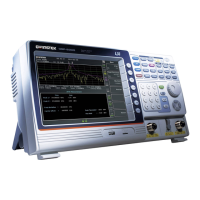
The Spectrogram and Topographic display
view can also use markers and delta markers to
mark the frequency and amplitude of points of
interest. This function is particularly useful as it
allows you to make delta measurements both in
the frequency and time domain.
 Loading...
