6-4
TITRATION MODE
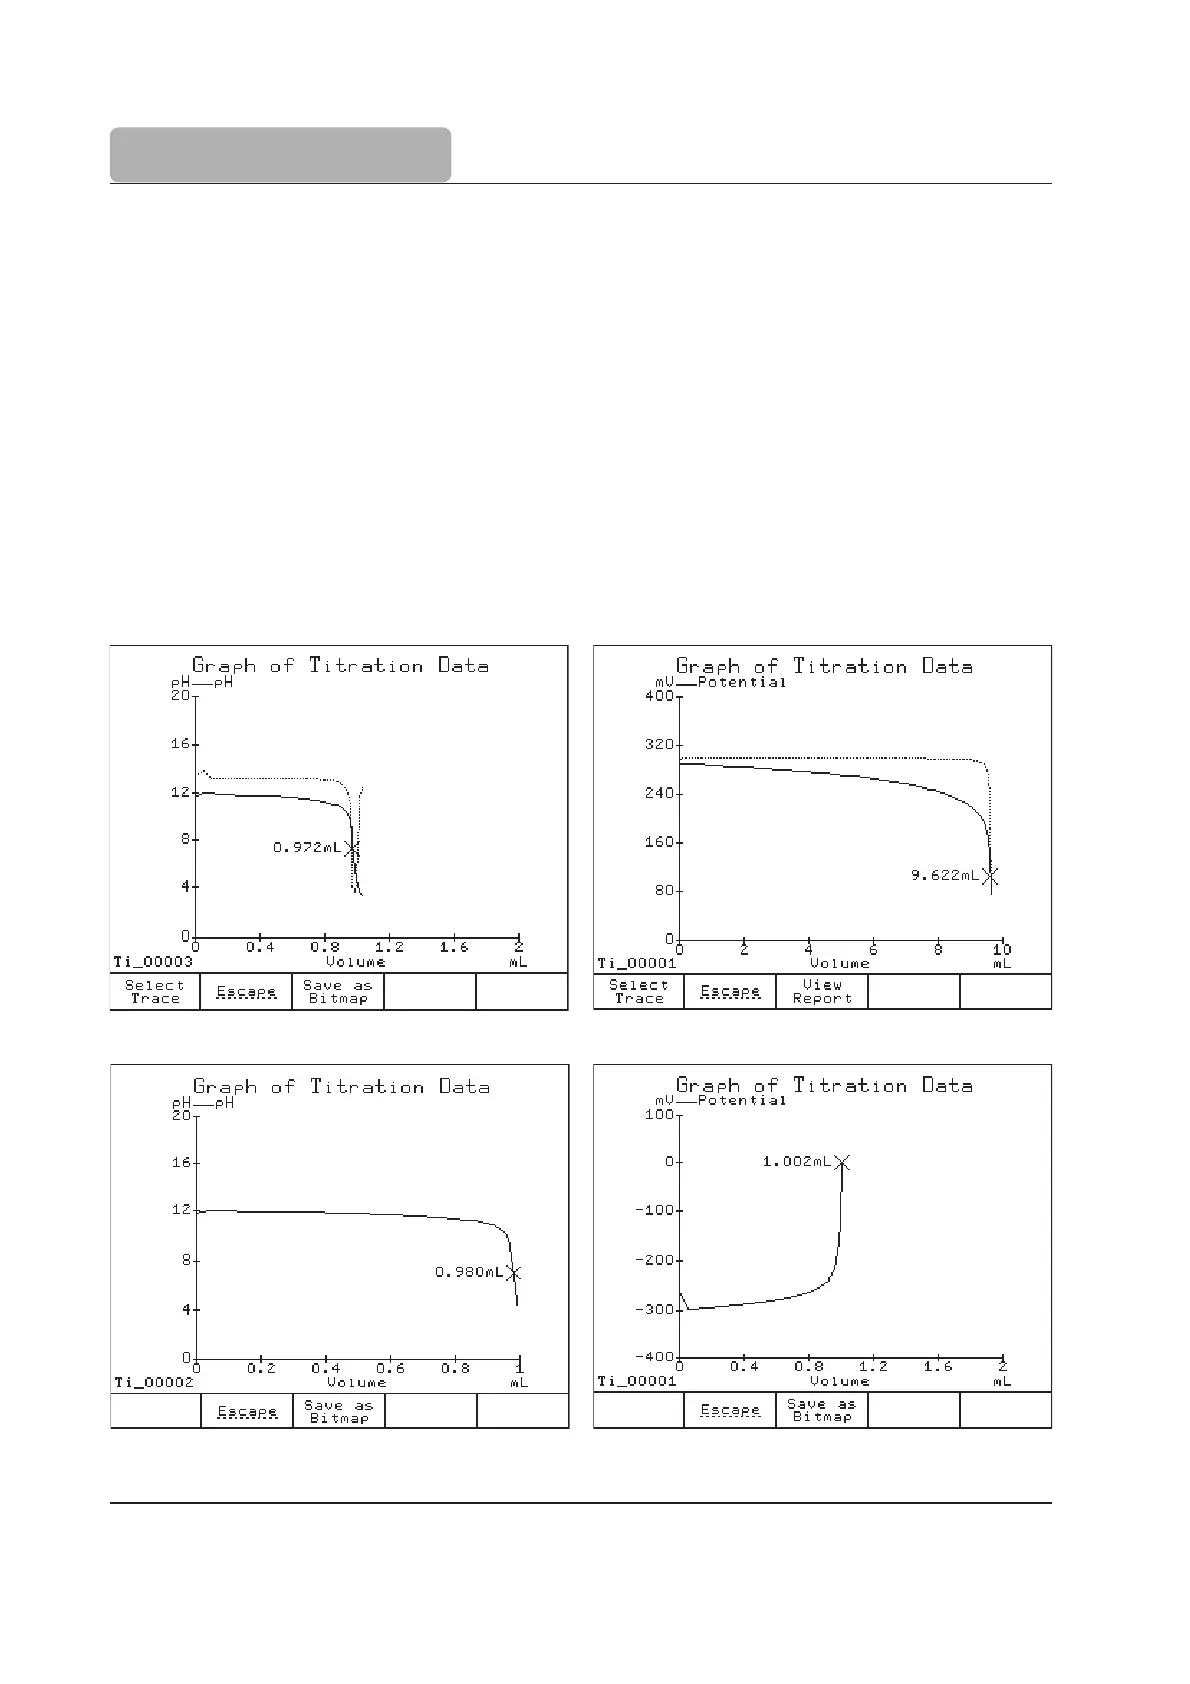
The potentiometric curve and the derivative curve are scaled to fit simultaneously inside the
display.
When a titration end point is successfully detected, the volume is displayed on the graph
and marked with an “x”:
The contents of the graph as related to an end point type are as follows:
Equivalence End Point (pH) -
the pH readings and the selected derivative vs. volume of
titrant are displayed (see Figure 1).
Equivalence End Point (mV) -
the mV readings and the selected derivative vs. volume of
titrant are displayed (see Figure 2).
Fixed End Point (pH)
- the pH readings vs. volume of titrant are displayed (see Figure 3).
Fixed End Point (mV)
- only the mV vs volume curve is displayed (see Figure 4).
Figure 1 Figure 2
Figure 3 Figure 4
 Loading...