6.2 Displaying a Time Series Plot (TIME PLOT screen)
102
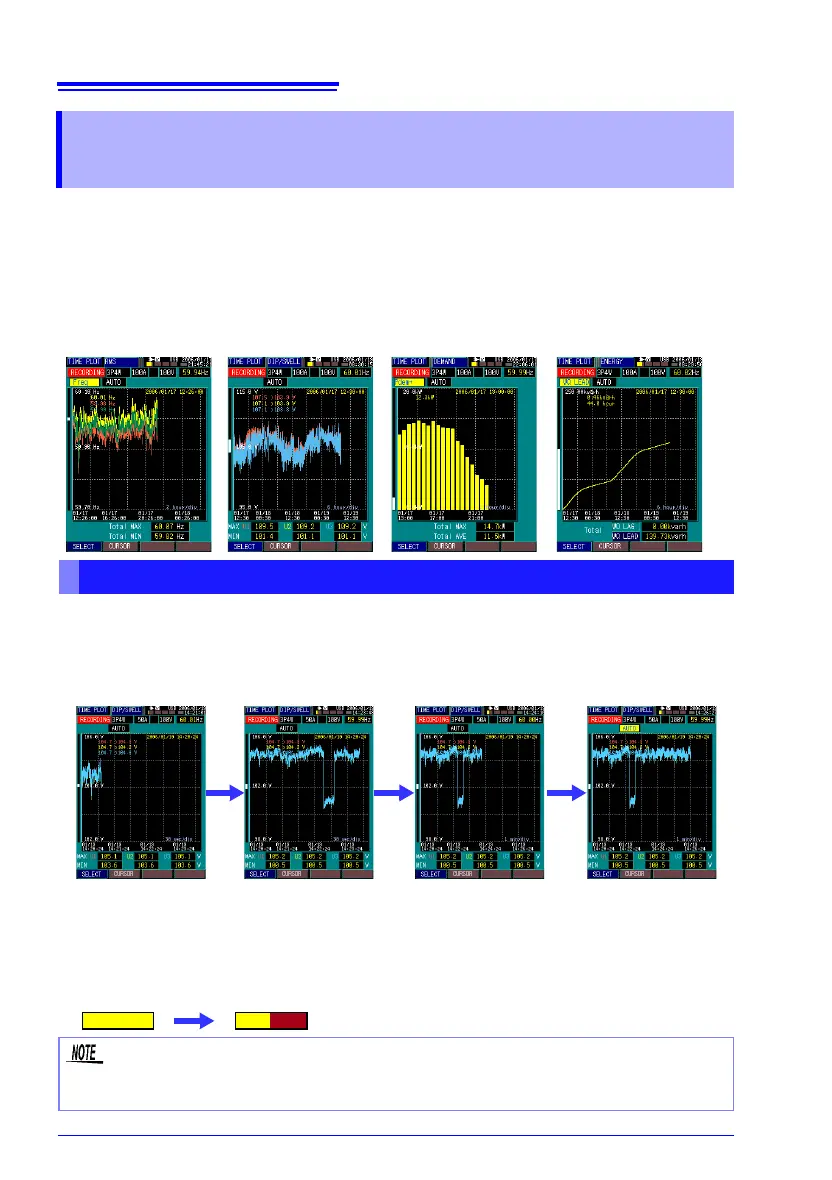
There are four TIME PLOT screens, called [RMS], [DIP/SWELL],
[DEMAND] and [ENERGY]. The displayed screen changes each time you
press the TIME PLOT key.
During the
[RECORDING] internal operating state, the graphs on the TIME
PLOT screen are refreshed at each measurement interval.
Screen Refresh
All graph plots begin from the left side, and extend to the right each time the
d
isplay refreshes. When a plot reaches the right side, it is horizontally com-
pressed by about half as it is continued.
Internal memory compression
When internal memory becomes filled with recorded memory data for
g
raphs, the internal memory is compressed and recording continues at a
longer interval.
6.2 Displaying a Time Series Plot
(TIME PLOT screen)
[RMS] [DIP/SWELL] [DEMAND] [ENERGY]
Common Operations and Screen Items (Common to TIME PLOT screens)
Drawing Starts Graph Fills Screen Graph is Compressed Plotting Continues
For additional details about screen refresh, internal memory compression and
maximum recording times, refer to
"Recordable TIME PLOT data period" (p. 155),
"Appendix 1 Interval and Recording Time Settings" (p. A1).