6.2 Displaying a Time Series Plot (TIME PLOT screen)
105
6
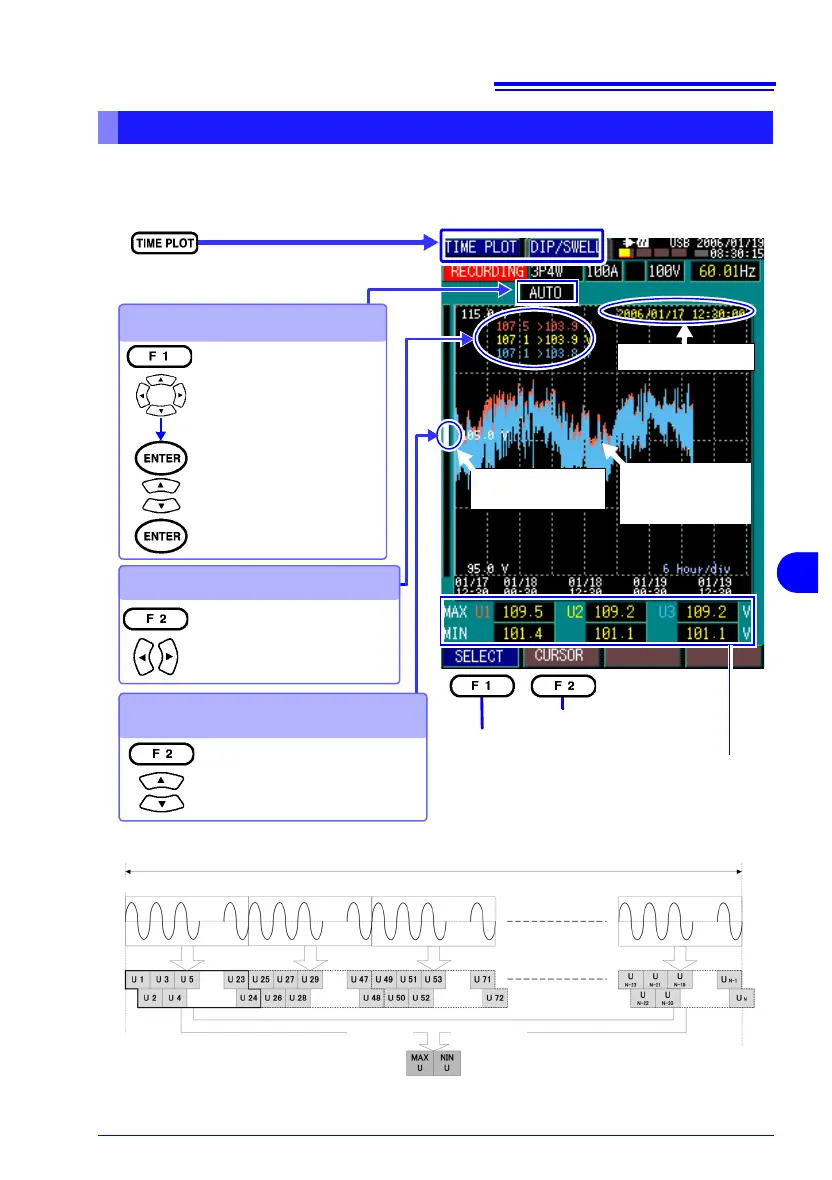
An rms voltage fluctuation graph is displayed.
You can view this graph to confirm rms voltage fluctuations when evaluating
voltage dip (DIP), voltage swell (SWEL) and interruptions.
Displaying a Voltage Fluctuation Graph [DIP/SWELL]
Select the screen.
Selects cursor operation.
Changes displayed parameters.
Graph Display
Position
Shows the global maximum (Total MAX), and
minimum (Total MIN) values over the whole mea-
surement period for each channel.
U1, U2, U3: each
indicated by the
selected colors
Viewing Values with the Cursor
Scrolls the fluctuation graph verti-
cally
Cursor Date/Time
Magnifying and Compressing
on Vertical Axis
Moving to a setting item
Vertical axis (display
magnification)
AUTO, ×1, ×2, ×5, ×10,
×25, ×50
Left: Display contents
(see table below)
Right:Time axis
Select from a pull-down
menu
Maximum value Minimum value
U1 102.7 V > 102.1V
U2 102.8 V > 102.2V
U3 102.7 V > 102.1V
Scrolling is useful for analyzing
the display after magnifying the
vertical axis.
200 ms (50 Hz: 10 waveforms, 60 Hz: 12 waveforms)
Rms voltage is calculated for each
waveform shifted by one-half cycle.
Example. When measuring 12 cycles at 60 Hz,
24 values of U are calculated within 200 ms.
RecordingRecording
Example.
Interval: 1 min,
N = 7200
TIME PLOT -[DIP/SWELL]
SYSTEM-[REC & EVENT] Interval (Selected Period)