Selectable Display Parameters
Display
Parameter
Display Contents
Freq Frequency
U1 CH1 voltage
I1 CH1 current
U2 CH2 voltage
I2 CH2 current
U3 CH3 voltage
I3 CH3 current
I4 Neutral current (calculated)
U1peak+ CH1 (+) voltage waveform peaks
U1peak- CH1 (-) voltage waveform peaks
I1peak+ CH1 (+) current waveform peaks
I1peak- CH1 (-) current waveform peaks
U2peak+ CH2 (+) voltage waveform peaks
U2peak- CH2 (-) voltage waveform peaks
I2peak+ CH2 (+) current waveform peaks
I2peak- CH2 (-) current waveform peaks
Display
Parameter
Display Contents
U3peak+ CH3 (+) voltage waveform peaks
U3peak- CH3 (-) voltage waveform peaks
I3peak+ CH3 (+) current waveform peaks
I3peak- CH3 (-) current waveform peaks
Uave CH average voltage
Iave CH average current
Psum 3-phase total active power
Qsum 3-phase total reactive power
Ssum 3-phase total apparent power
PFsum
3-phase total power factor /
Displacement power factor
THD1
CH1 voltage total harmonic dis-
tortion
THD2
CH2 voltage total harmonic dis-
tortion
THD3
CH3 voltage total harmonic dis-
tortion
Uunb Voltage unbalance factor
Some parameters are not selectable depending on the selected wiring configuration.
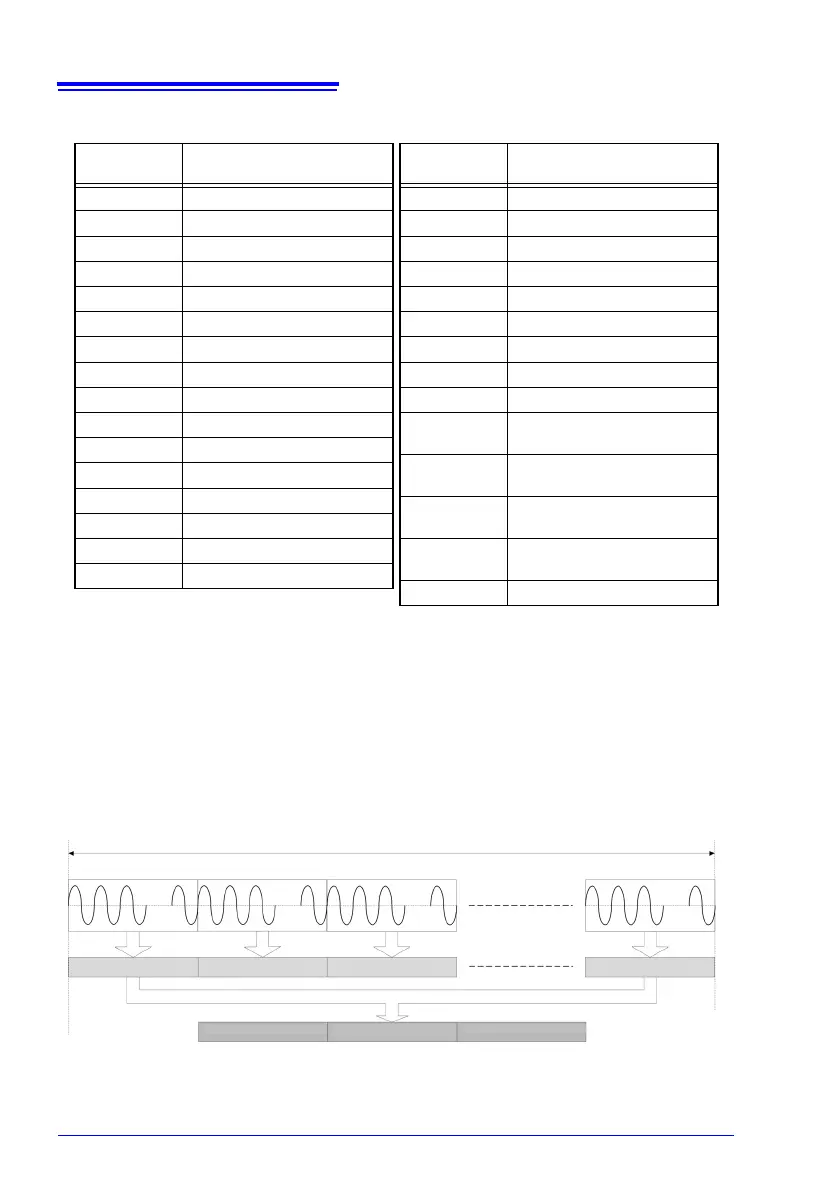
SYSTEM - [REC & EVENT] Interval (Selected Period)
200 ms (50 Hz: 10 waveforms, 60 Hz: 12 waveforms)
Rms value 1 Rms value 2 Rms value 3 Rms value N
Example
Interval: when 1 min,
N = 300
MAX rms value
Recording AVE rms
Recording MIN rms
Recording Recording Recording
TIME PLOT - [RMS]
 Loading...


