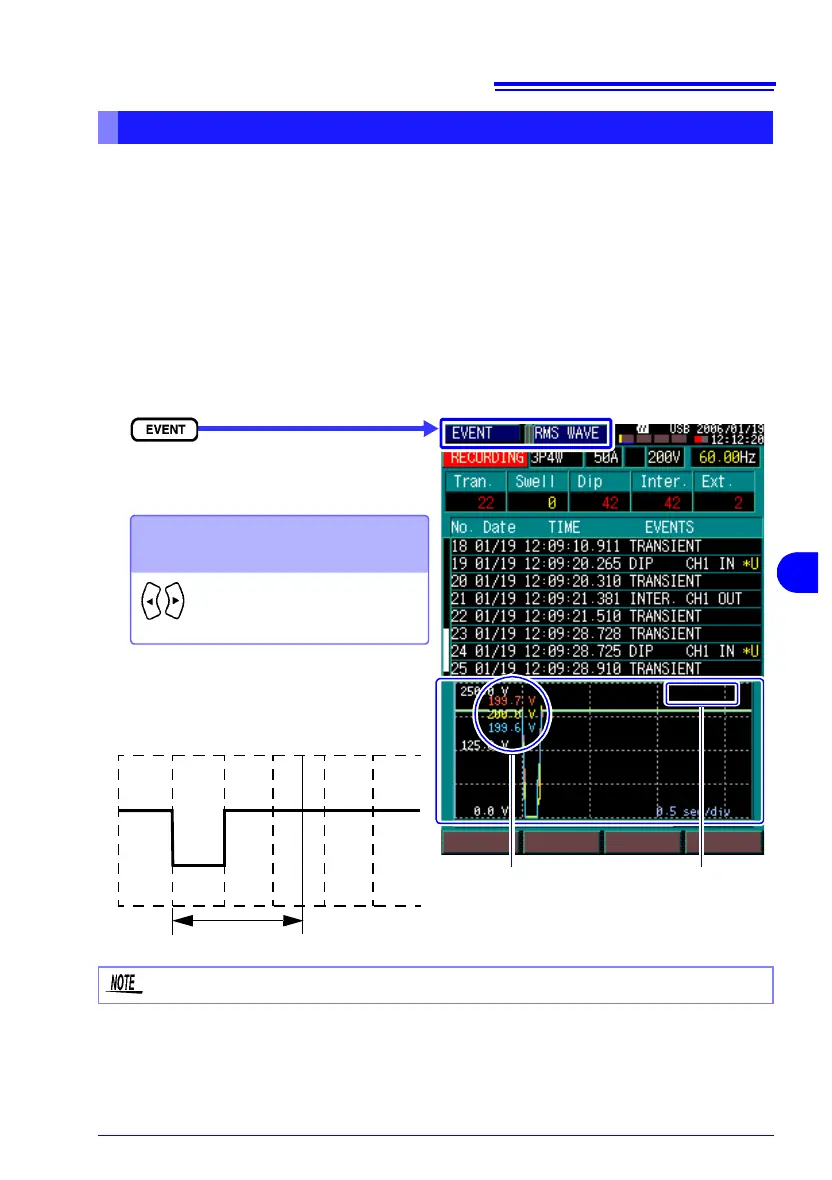
6.3 Viewing Anomalous Phenomena (EVENT screen)
121
6
Select a voltage dip, voltage swell or interruption EVENT IN (Onset) event
having an *U indicator in the Event List to display its voltage fluctuation
graph.
Pressing the up/down cursor keys switches the display sequentially
between events. The rms voltage fluctuation graph is calculated from each
half-cycle-shifted waveform (Urms 1/2).
The event voltage fluctuation graph begins about 0.5 seconds before detec-
tion and continues to about 2.5 seconds after detection. The graph is drawn
according to the selected channel colors.
Displaying Detected Voltage Fluctuation Events [RMS WAVE]
Select the screen.
The horizontal axis is fixed at 0.5 sec/div.
To perform cursor measurement
Scrolls the graph horizontally
Cursor value
(Rms voltage on
each channel)
Cursor period
(Elapsed time from
event detection to
cursor position)
0.000 sec
Cursor period
Cursor period calculation is valid only for 50 or 60 Hz line frequency.