6.2 Displaying a Time Series Plot (TIME PLOT screen)
107
6
Energy values are calculated as power times time.
Active power value [Wh] = Active power [W] x Time [h]
Reactive power value [Varh] = Reactive power [Var] x Time [h]
Example. When a 100 W light bulb is lit continuously for two hours, 200 Wh
of active power is consumed.
Power values used for power company transactions are usually active
power values [kWh]. This instrument displays the cumulative power value
from the beginning to the end of a recording as a graph.
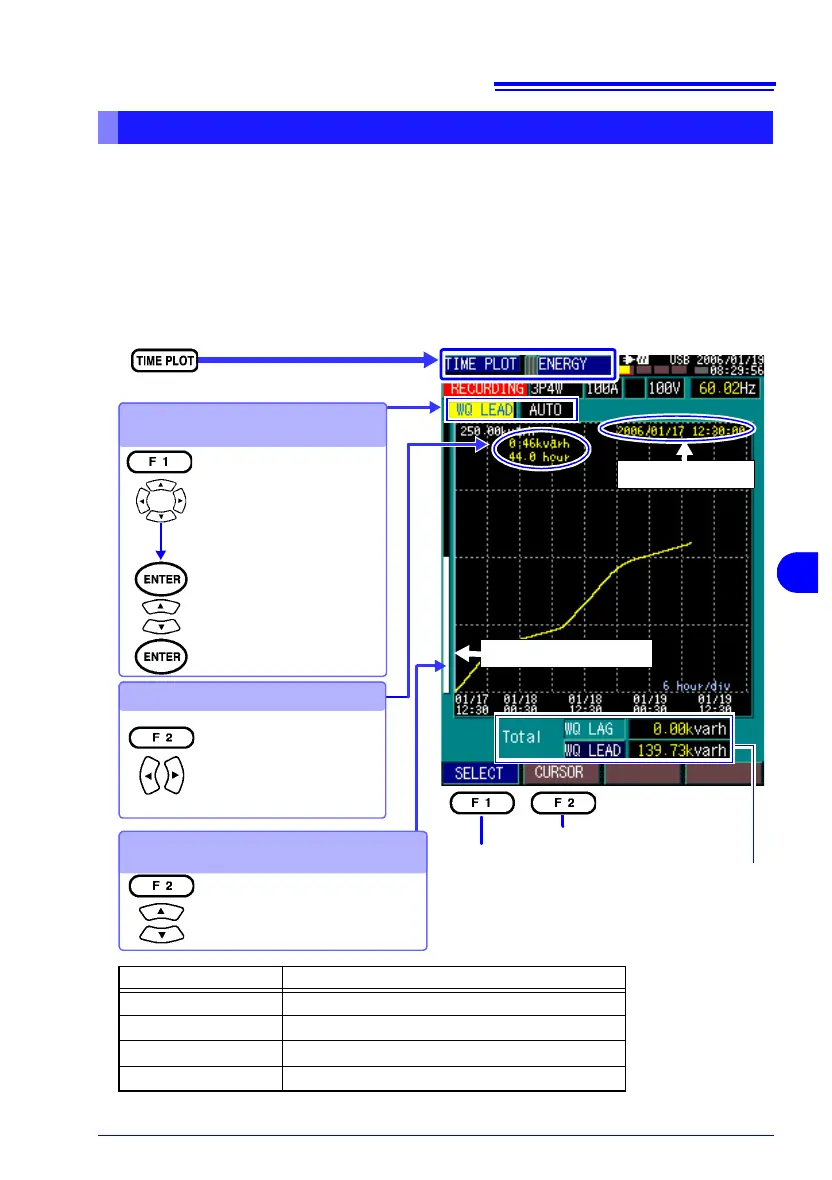
Displaying an Energy Consumption Graph [ENERGY]
Select the screen.
Selects cursor operation.
Changes displayed parameters.
Selecting, Magnifying and
Reducing Display Parameters
Graph Display Position
Moving to a setting item
Left: Display contents
(see table below)
Right: Vertical axis
AUTO, ×1, ×2, ×5, ×10,
×25, ×50
Select from a pull-down
menu
Display Parameter Display Contents
WP+ Active Power (consumption only)
WP- Active Power (regenerated only)
WQLAG Reactive Power (lagging only)
WQLEAD Reactive Power (leading only)
Shows the global maximum energy value over
the whole measurement period.
Viewing Values with the Cursor
Scrolls the fluctuation graph verti-
cally
Cursor Date/Time
The energy value is the 3-
phase total
Elapsed time is also dis-
played (HH:MM:SS)
Scrolling is useful for analyzing
the display after magnifying the
vertical axis.