6.2 Displaying a Time Series Plot (TIME PLOT screen)
103
6
View a fluctuation graph of parameters selected from voltage; current; volt-
age and current waveform peak values (
±); frequency; active, reactive and
apparent power; power factor; displacement power factor; THD and voltage
unbalance factor.
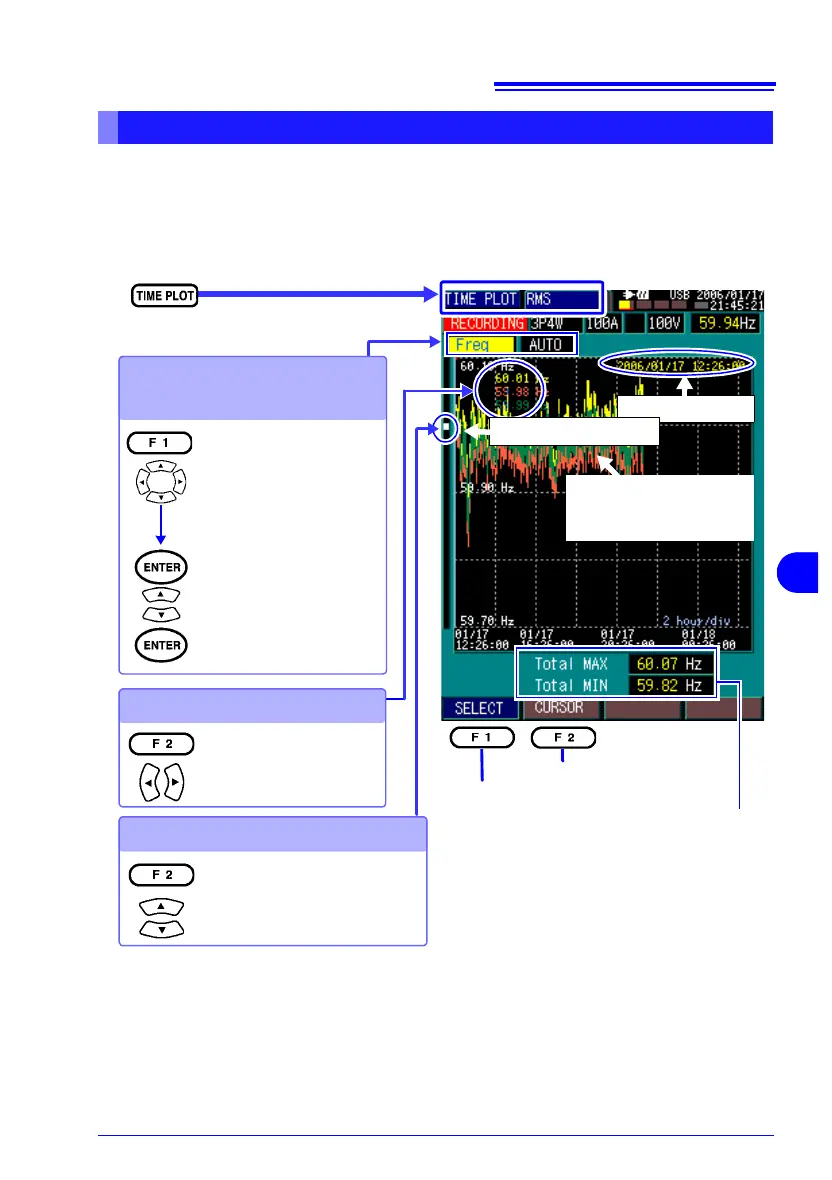
Displaying the Rms Fluctuation Graph [RMS]
Select the screen.
Selects cursor operation.
Changes displayed parameters.
Selecting, Magnifying and
Reducing Display Parameters
on the Vertical Axis
Graph Display Position
Moving to a setting item
Left: Display contents
(p. 104)
Right: Time axis (display
magnification)
AUTO, ×1, ×2, ×5, ×10,
×25, ×50
Select from a pull-down
menu
Shows the global maximum (Total MAX), and
minimum (Total MIN) values over the whole
measurement period.
Maximum Value: Yellow
Average Value: Green
Minimum Value: Red
Viewing Values with the Cursor
Scrolls the fluctuation graph verti-
cally
Cursor Date/Time
Scrolling is useful for analyzing
the display after magnifying the
vertical axis.