5.3 Verifying Correct Wiring (Connection Check)
87
5
Verify Settings
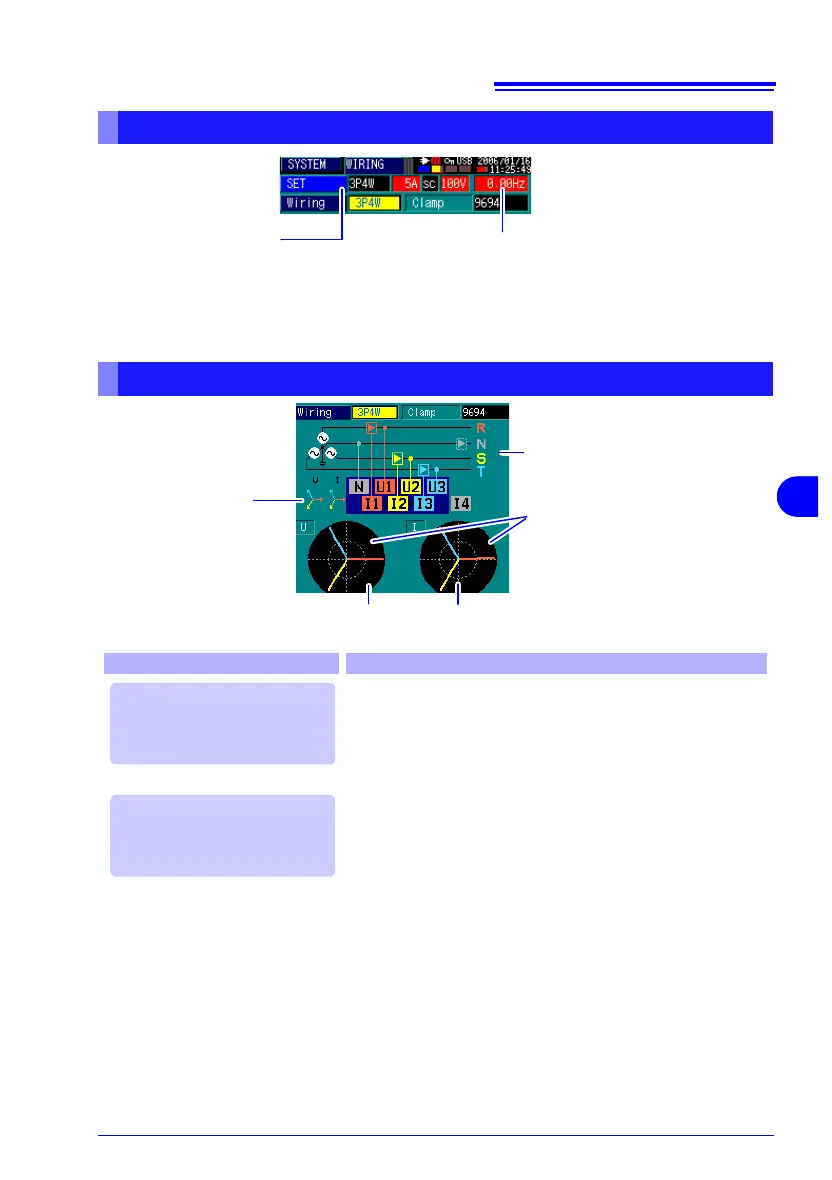
Frequency
Values are displayed in red when differ-
ent from the line frequency setting.
Change the line frequency setting if nec-
essary.
Current Range
Values displayed in red indicate over-
range. Select a higher range, or use a
clamp sensor with a higher rating.
Verify the Vector Display
In this case Check
• Voltage vector
Verify that the voltage cords are securely connected to the
v
oltage input terminals and lines to be measured.
• Current vector
Verify that the clamp sensor leads are securely connected
to th
e current input terminals and lines to be measured.
• Voltage vector
Verify that the voltage cord connections correspond to the
w
iring diagram.
• Current vector
Verify that the clamp sensor leads are securely connected
to th
e current input terminals and lines to be measured
Real-Time Wiring
Vector Diagrams
Correct Vector
Diagram
Voltage Vectors
Current Vectors
Wiring Configuration Diagram
If the length of the vectors is
too short, or of differing
lengths
If a vector's direction
(phase) or color is wrong