NORMAL OPERATION
Part. No. 2400M2501_6 Touchpoint Pro
114 Technical Handbook
Use this option to Inhibit the channel. Once selected this option changes to Clear Inhibit.
Use this option to Force a relay output channel to its active state. Once selected this
option changes to Clear Force. The channel status changes to Fault.
Use this option to Force a relay output channel to its deactivated state. Once selected this
option changes to Clear Force. The channel status changes to Fault.
Table 39. Inhibit / Force Options
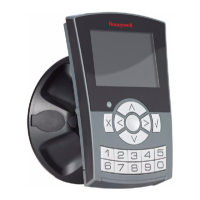
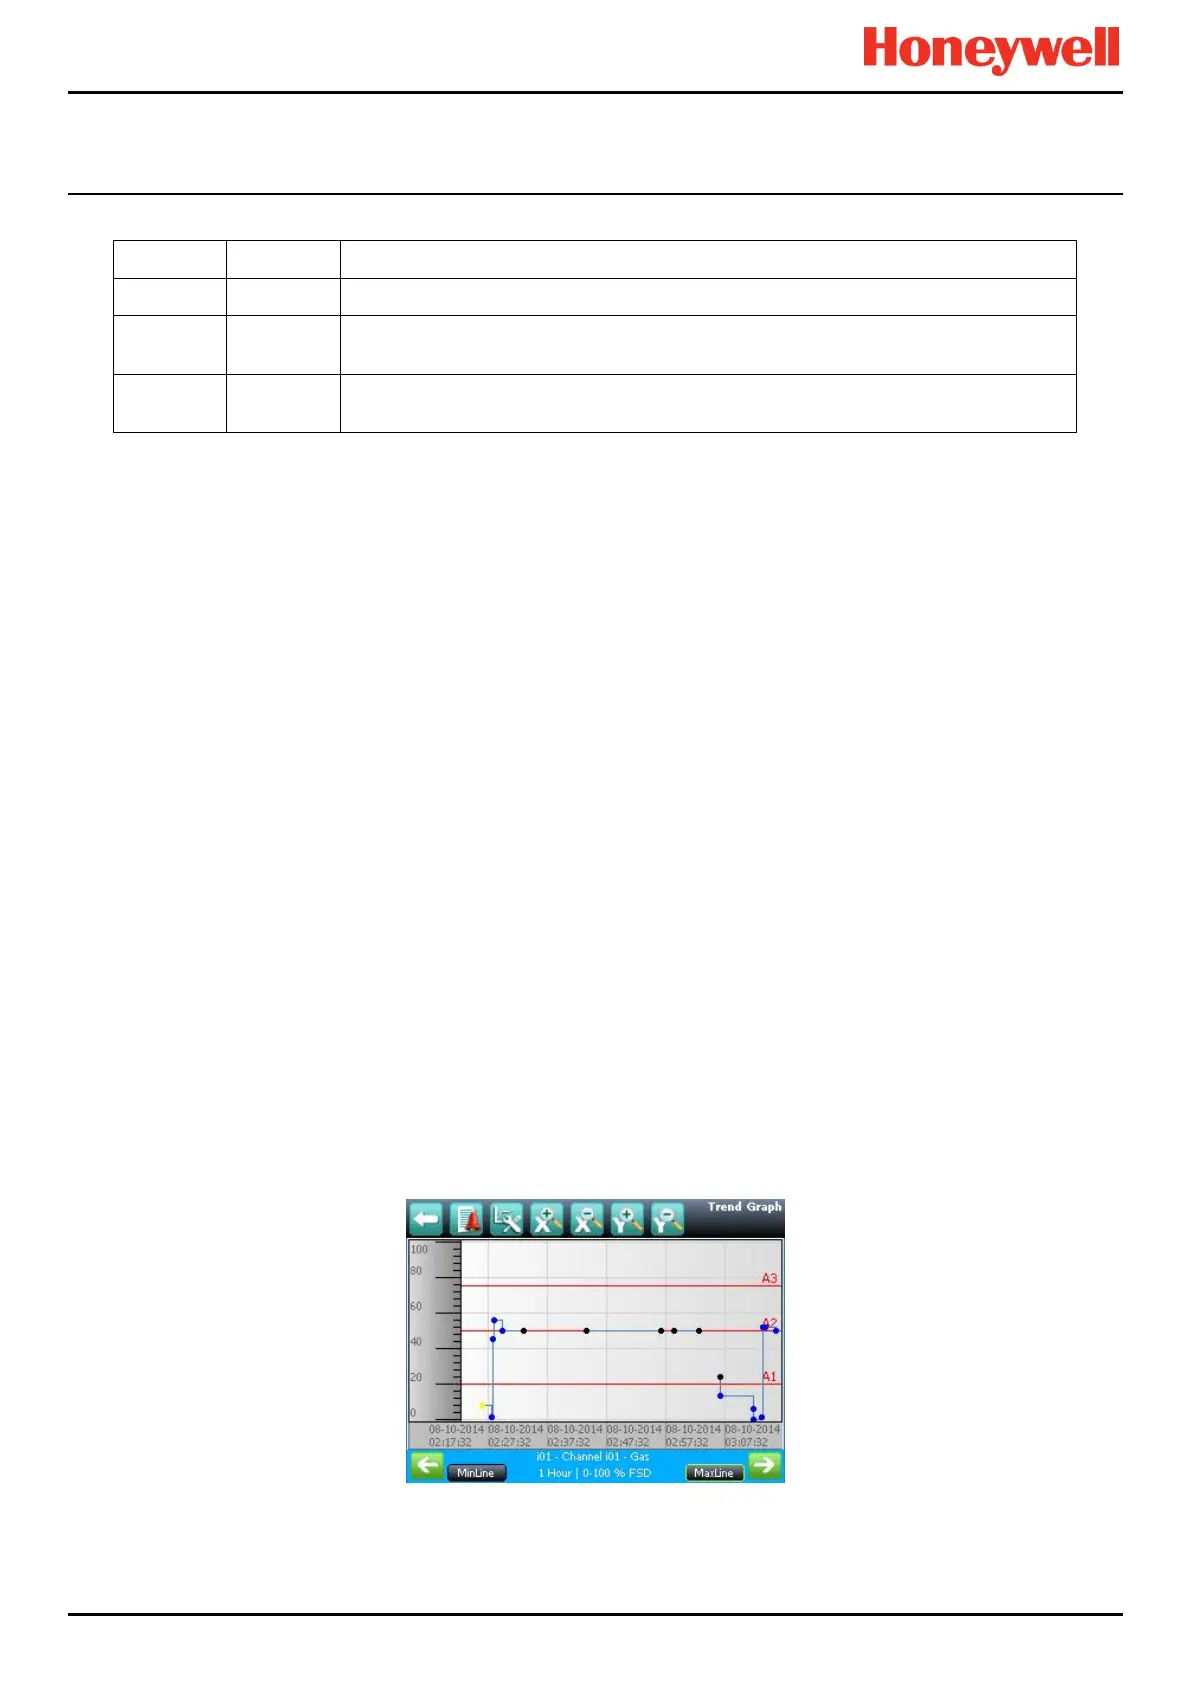
13.10 How to View the Trend Graph
The trend graph shows the history of the signal on an analogue input channel. The signal value is logged when it changes,
or every one hour if there is no change.
Note: TPPR does not adjust automatically for daylight savings time. Be aware that if the date and time are changed to a time
in the past, (for example ending daylight savings time) TPPR will retain a backup of the previous data.
Note: TPPR logs the trend data point when the system is in Field Inputs Test Mode, but does not log it when in the
Configuration Settings Test or Cause and Effect Test modes.
Note: The system logs when the value changes, with a resolution determined by the gas range of the channel. For a gas
range of less than 10, the resolution is 0.01, for a gas range of 10 to 99 the resolution is 0.1, and for a gas range of 100 or
more, the resolution is 1.
Note: The display may not show negative values. If negative values are suspected, due to zero drift or an input fault, use the
Trend Graph Settings icon to offset the Y axis zero.
13.10.1 To View the Trend Graph
1. From the System Status screen navigation bar, select the Inputs icon.
2. A list of all input channels is shown in order of Channel ID.
3. Select the required channel, and select Trend Graph from the popup menu.
4. The trend graph will be displayed.
5. Use the forward and backward arrows to scroll through the graph. Expand or reduce the axes using the X+, X-, Y+
and Y- buttons.
If there are more data points than the number of pixels available on the screen, TPPR will display the maximum value within
each set of points. This is the MaxLine. (For example, if one pixel needs to represent 12 seconds, it will display the
maximum value that occurred during those 12 seconds.) If you toggle to MinLine, TPPR will display the minimum value
within each set of points.
Note: Webserver (if used) will by default display both MaxLine and MinLine. This can be changed to show only MaxLine,
only MinLine or both.
Figure 91. Trend Graph Screen
 Loading...