Chapter 9: Qualification Study
ValProbe RT User Manual 95
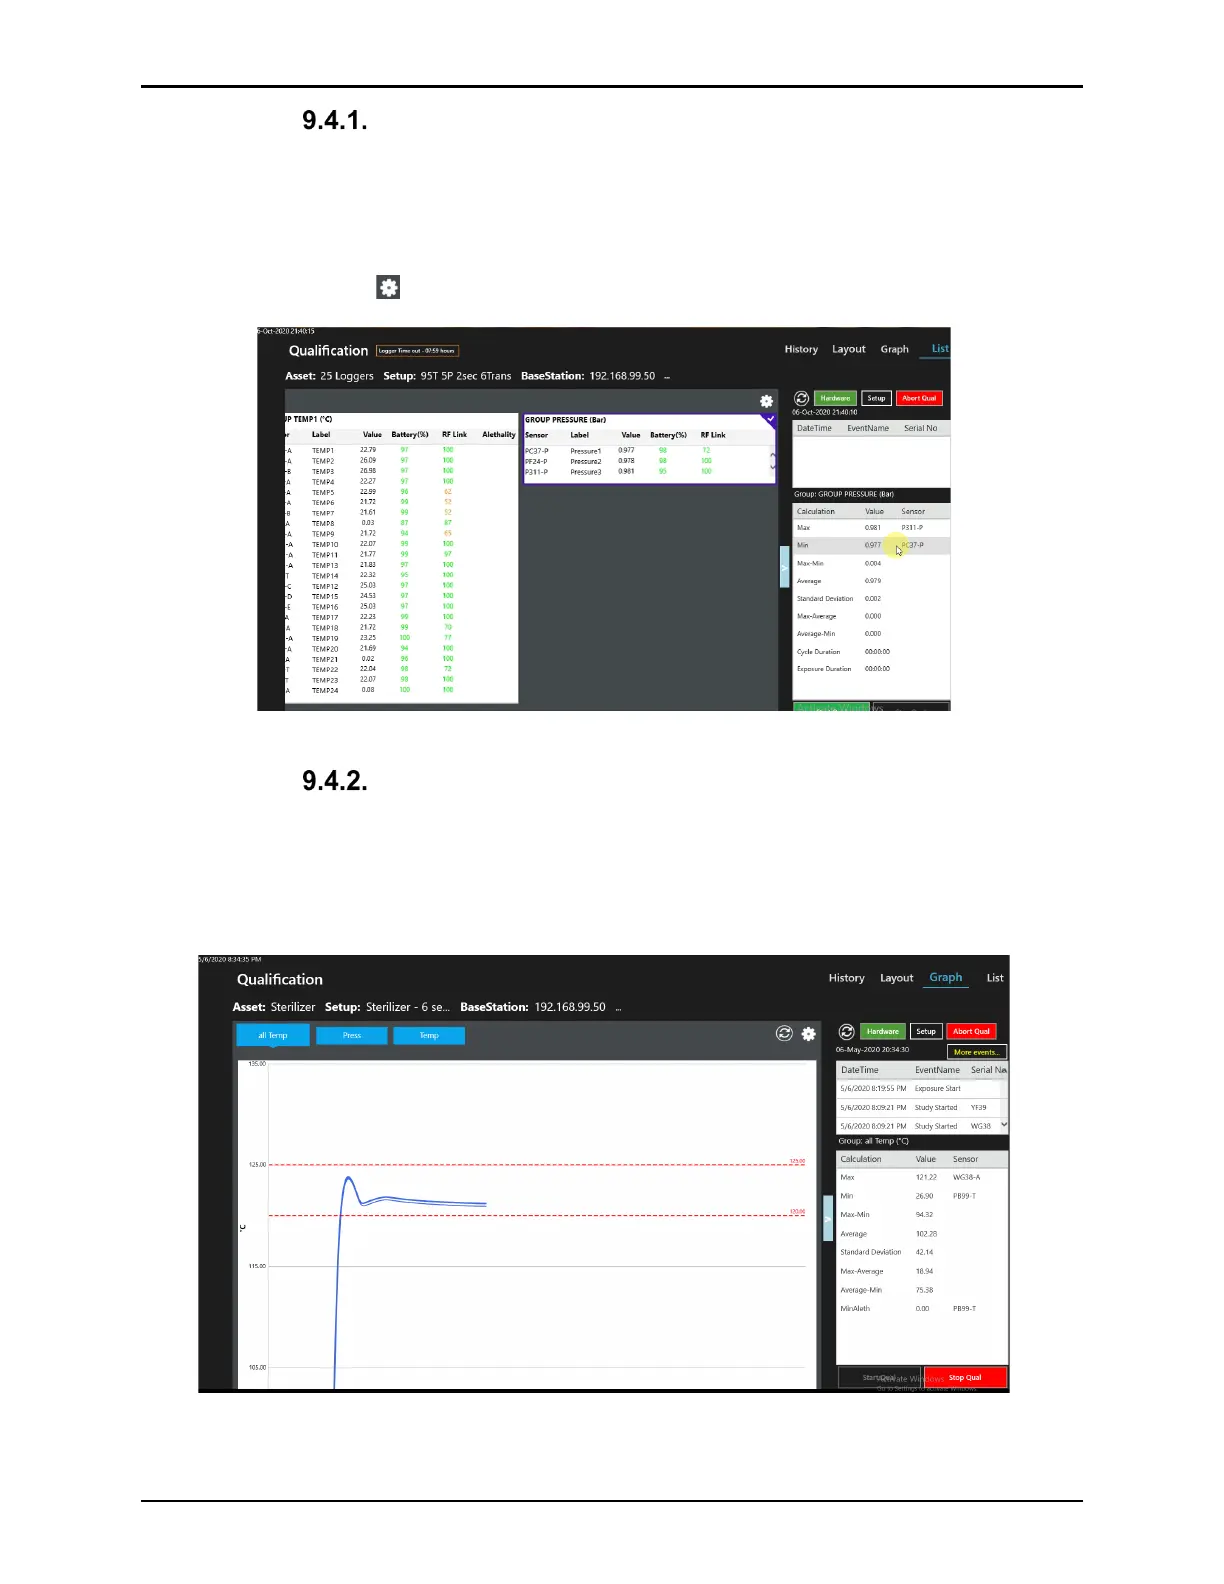
List View
The List view display window contains tables for each Group containing the group name,
sensor serial number, label, current value, Logger battery life, RF signal strength and
Accumulated Lethality if defined in the Setup. The Logger Time out displayed at the top of the
screen is a countdown until Loggers timeout. To customize the columns to include in the
Groups table select the icon.
Figure 123: List View - Real-Time Data
Graph View
The Graph view display window contains real-time graphical trending of sensor readings. The
sensors are organized in Groups defined in the setup. Select the Group name buttons above
the graph to display different groups. Use the blue box with arrows to expand the Graph to full
screen.
Figure 124: Graph View