Chapter 10: Live Monitoring Mode
ValProbe RT User Manual 99
Note: When using more than 25 Loggers, ensure that the transmission rate is equal or
greater than the sampling rate. If not, a message displays a warning that you cannot
move forward. Modify the setup and the transmission/sampling rates before proceeding
with 25 or more Loggers.
Figure 131: Select Loggers
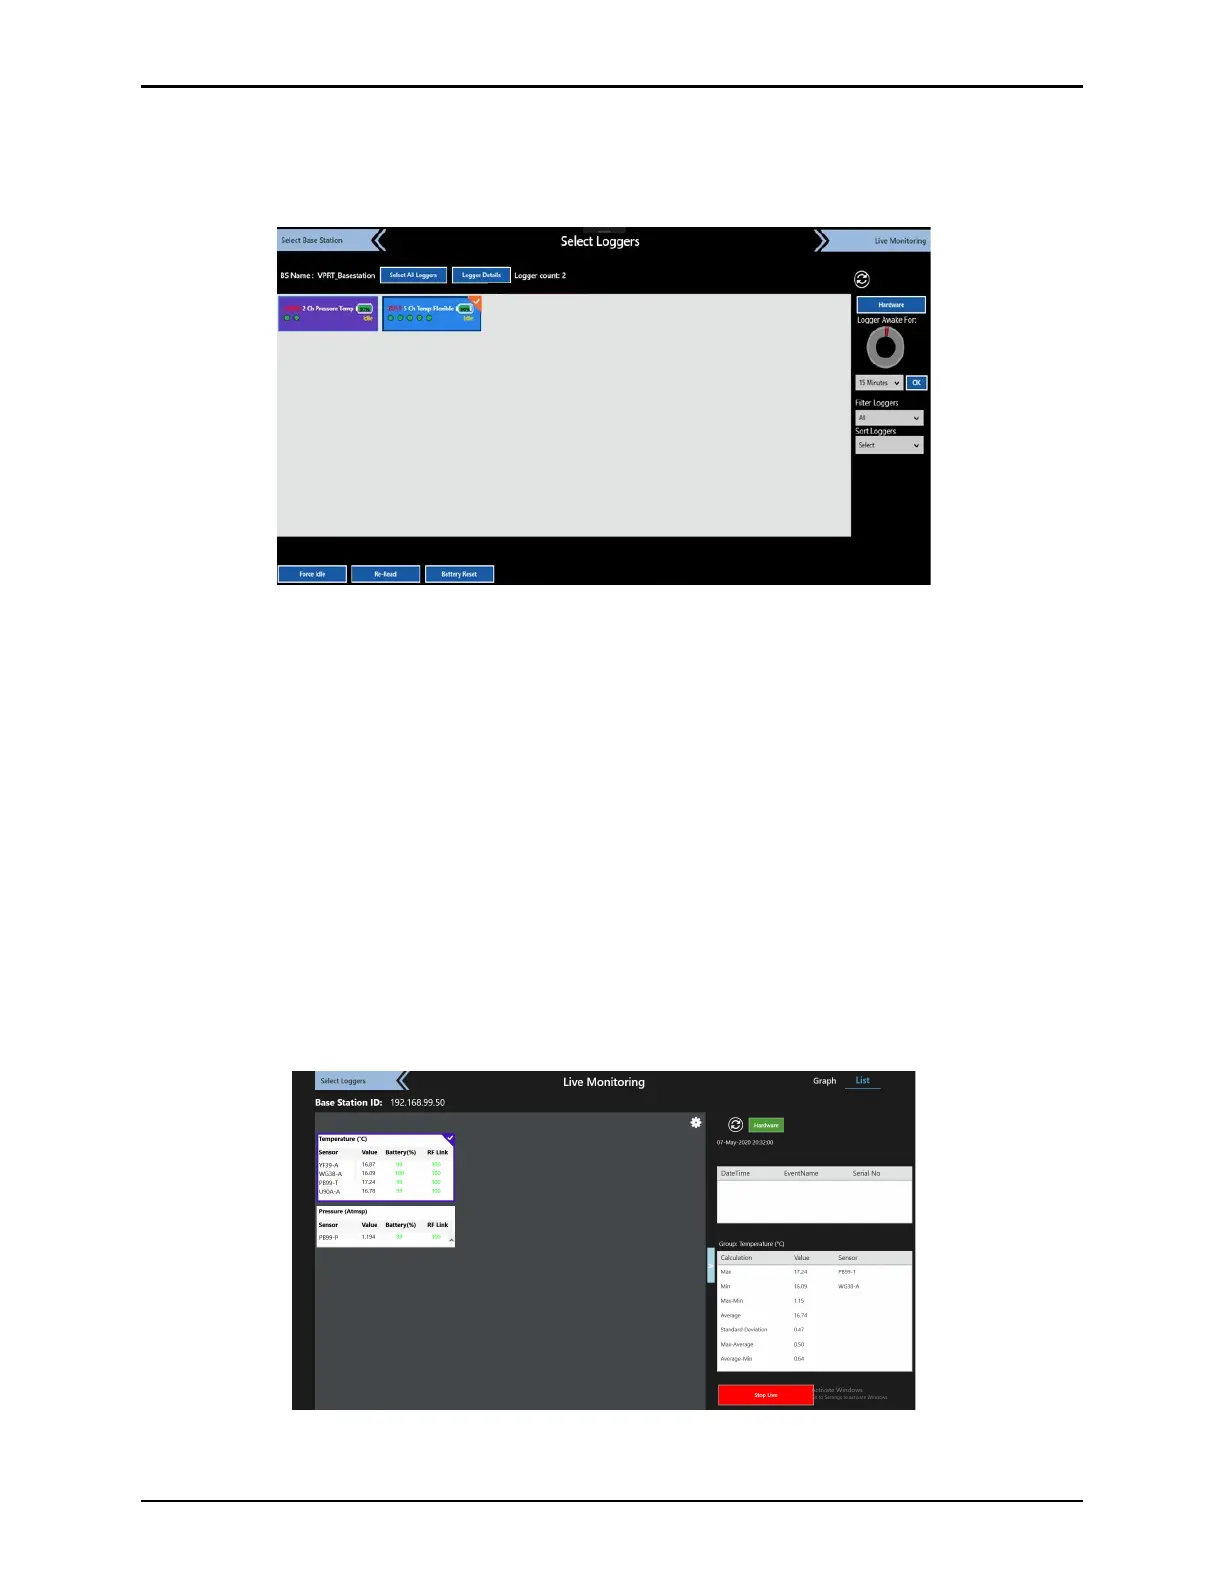
10.2. Live Monitoring Displays
In the Live Monitoring mode, no study is running, and the data is updated at the display rate of
every 10 sec. The header displays only the IP address of the Base Station. The User can
select between a List display or Graph display. Both displays have basically the same
functionality except in the way they present data the sensors that are displayed are the ones
selected on the Select Sensor screen and are separated by types of Sensors (temperature
and pressure). The Calculation table displays Statistical Calculations based on the type of
sensors selected (check marked).
The List and Graph screens also contains a Hardware button displaying the connectivity
status of all hardware (Console, Base Station, IRTD, Chambers, and Baths). Live collection
structure (sensor and groups definition) follows the last transferred setup (to transfer a setup,
first start a study). If the ValProbe RT is in monitoring status, a User can switch between List
and Graph Views to display live data.
Figure 132: List View - Monitoring