Chapter 12: Qualification Reports
ValProbe RT User Manual 144
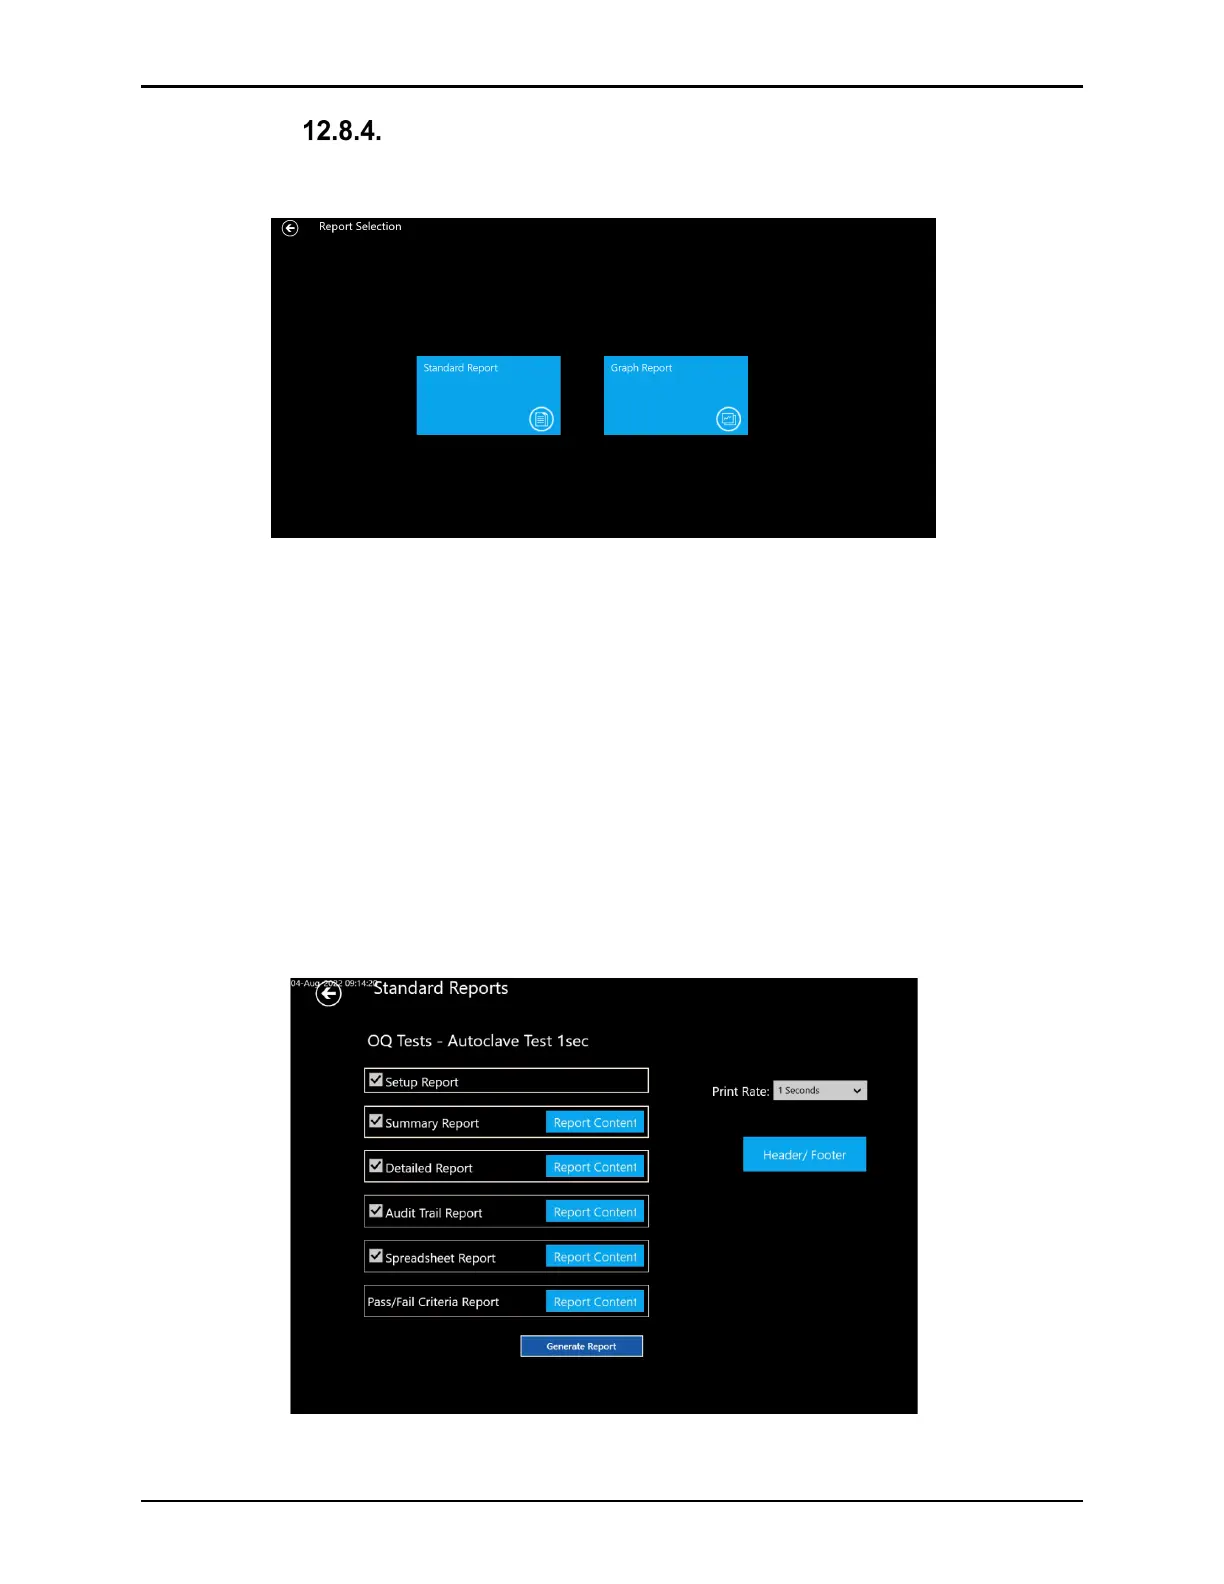
Report Selection
On the Report Selection screen, select between Standard text reports or Graph reports.
Figure 182: Report Selection Screen
Graph Reports:
The Graph Reports allows the User to report the Qualification data in graphical format. See
section (12.4 Graph Reports) for a detailed explanation of the options and tools available for
graphing.
Standard Reports:
On the Standard Reports screen the User may select which reports to generate. All reports
and calculations are initiated from the Storage / Sample rate defined in the Setup.
Multiple reports may be selected at one time to improve efficiency. All generated reports are
formatted in .pdf. All .pdf reports are automatically saved into the Asset where the Qualification
file was stored and placed in the Report tile.
Figure 183: Standard Report Selection Screen