Chapter 9: Qualification Study
ValProbe RT User Manual 96
Graph View options are accessible by selecting the icon. In the options, the User can add
limit lines, manually adjust scaling, and define parameters for zooming.
Select Limit to define upper and lower limits to the graph. Select Reset in the Limits window
to disable limits.
Select Manual Scale to define the upper and lower scaling for the graph. Select Reset in the
Manual Scale window to reset manual scaling.
Use the Zoom option to define whether to zoom the X- or Y-axis, or both. Once defined, use
the touch screen to control zooming in the desired view. Select Reset to disable Zoom.
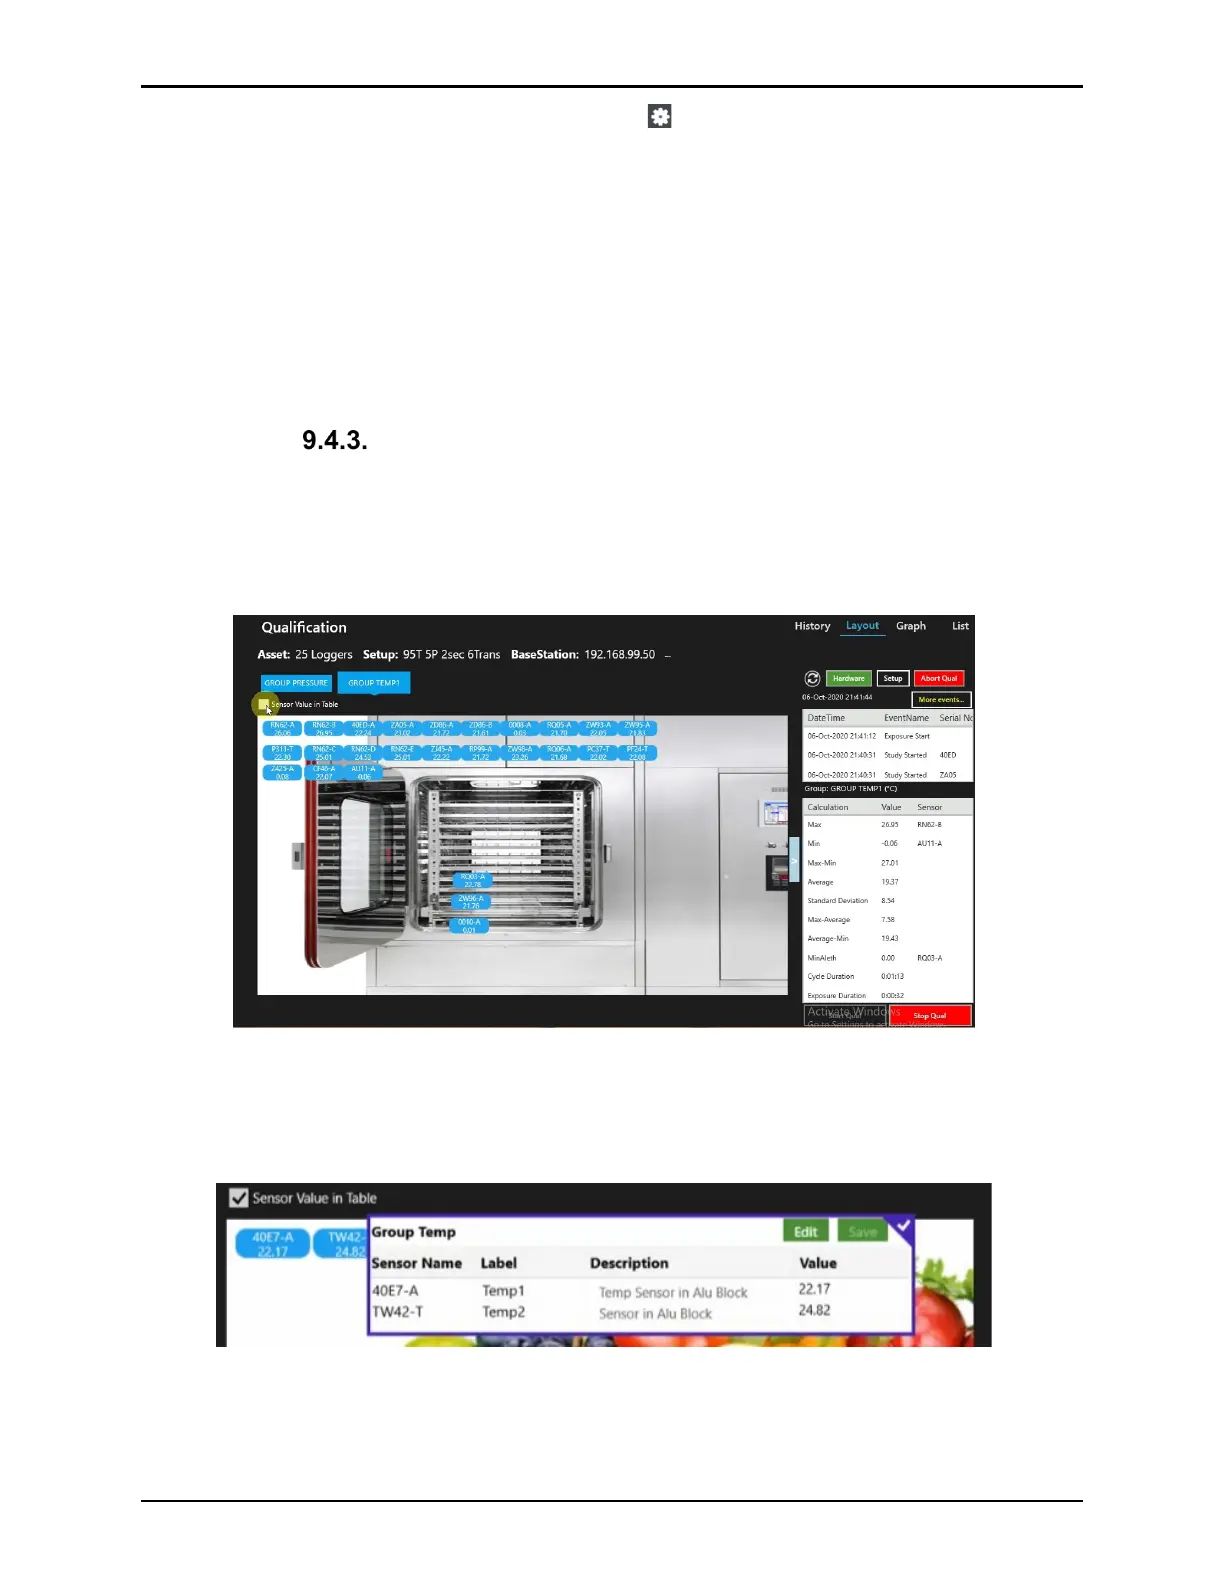
Layout View
The Layout view display window includes sensor placement in a graphic view of the Asset
along with real-time readings. Sensors and background pictures are displayed by Groups
defined in the setup. Select the Group Name buttons above the graph to display the different
groups. Use the blue box with arrows to expand the Graph to full screen.
Figure 125: Layout View
Check the Sensor Value checkbox to display the sensor values and description in a table on
screen. Selecting Edit permits editing the sensor description, select Save when finished to
save any changes.
Figure 126: Sensor Value in Table