Chapter 10: Live Monitoring Mode
ValProbe RT User Manual 100
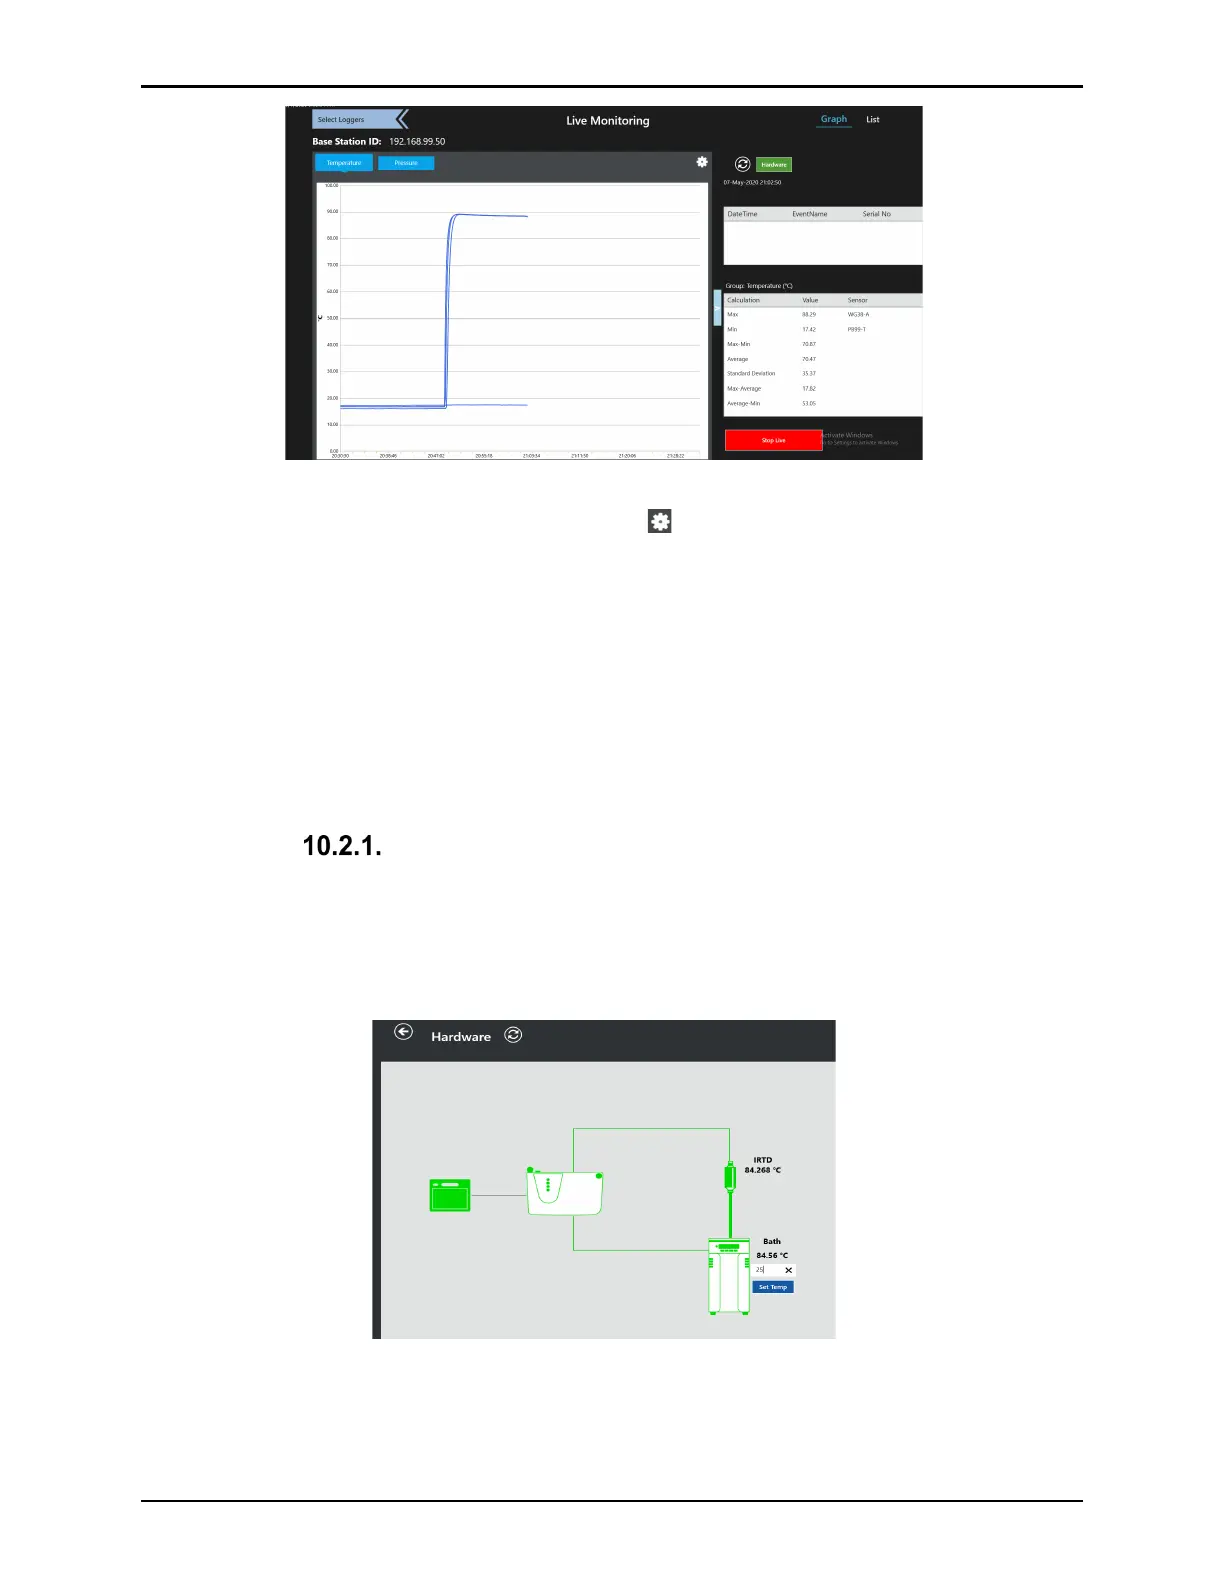
Figure 133: Graph View - Monitoring
Graph View options are accessible by selecting the icon. In the options, the User can add
limit lines, manually adjust scaling, and define parameters for zooming.
Select Limit to define upper and lower limits to the graph. Select Reset in the Limits window
to disable limits.
Select Manual Scale to define the upper and lower scaling for the graph. Select Reset in the
Manual Scale window to reset manual scaling.
Use the Zoom option to define whether to zoom the X- or Y-axis, or both. Once defined, use
the touch screen to control zooming in the desired view. Select Reset to disable Zoom.
Hardware Communications Connections
On any of the live data monitoring screens, select Hardware to see communications
connections between pieces of hardware. On the Hardware screen, each hardware item
connected to the Base Station is displayed. A green line indicates proper communications while
a gray line indicates a communication problem.
Figure 134: Hardware Monitoring
By selecting each connected hardware icon, the software displays key information about the
hardware.
The IRTD provides the real-time display of the IRTD standard.