Chapter 12: Qualification Reports
ValProbe RT User Manual 123
Once groups are documented, the last pages of the report list System and Event messages
and a footer.
Before printing the Summary report, use the Report Content options to add Setup information
or a graph of the complete study to the Summary report.
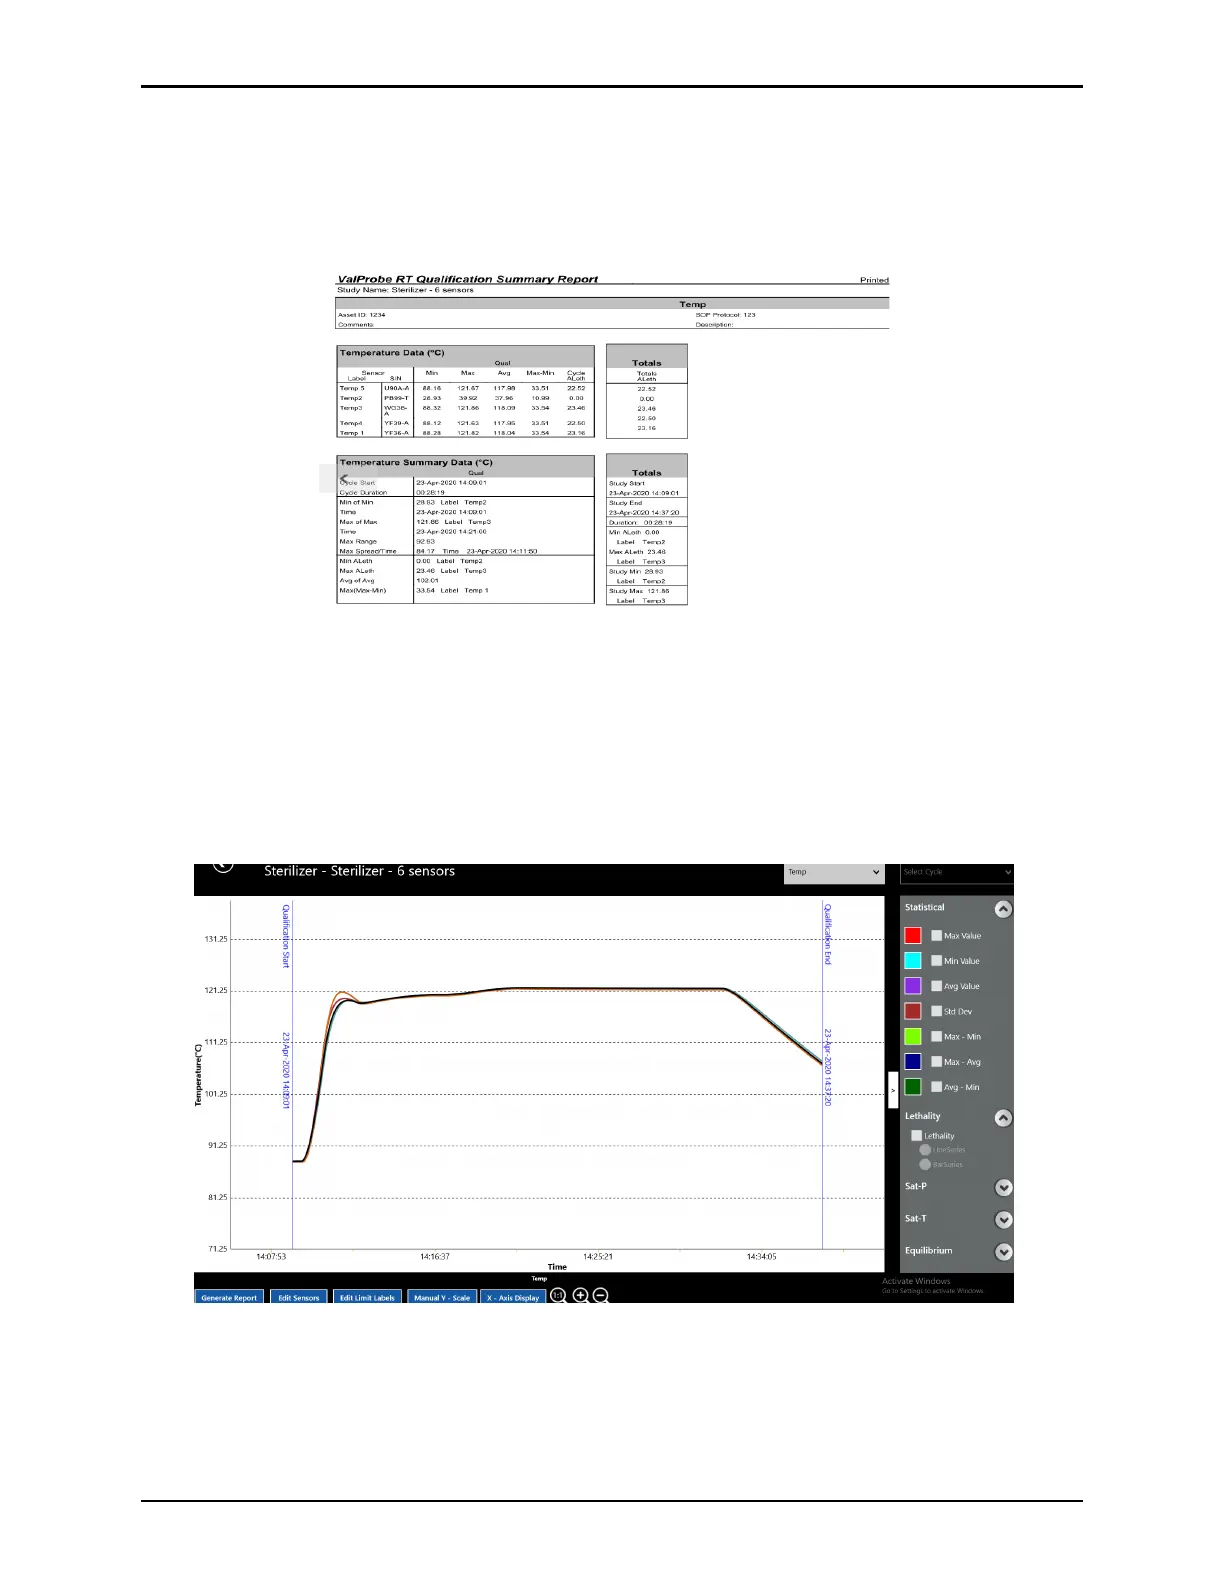
Figure 162: Summary Report
12.4. Graph Reports
Graph reports offer a flexible tool to analyze data from the raw encrypted Qualification file and
create numerous graph reports.
The Graphs reports, calculations, and groups they utilize are based on the sampling rate along
with other parameters defined in the Setup.
Figure 163: Graph Report Screen
The Graph report defaults to displaying All Temp Sensors for the duration of the Qualification
study. Use the Select Group dropdown at the top right of the screen, to select different types
of sensors or groups to display. Use the Cycle dropdown to select defined Cycles for graphing.
Use the > or < to the right of the graph to maximized to full screen or minimized the graph.