– Programming Manual 11. Measurement adjustment 65
11.6.
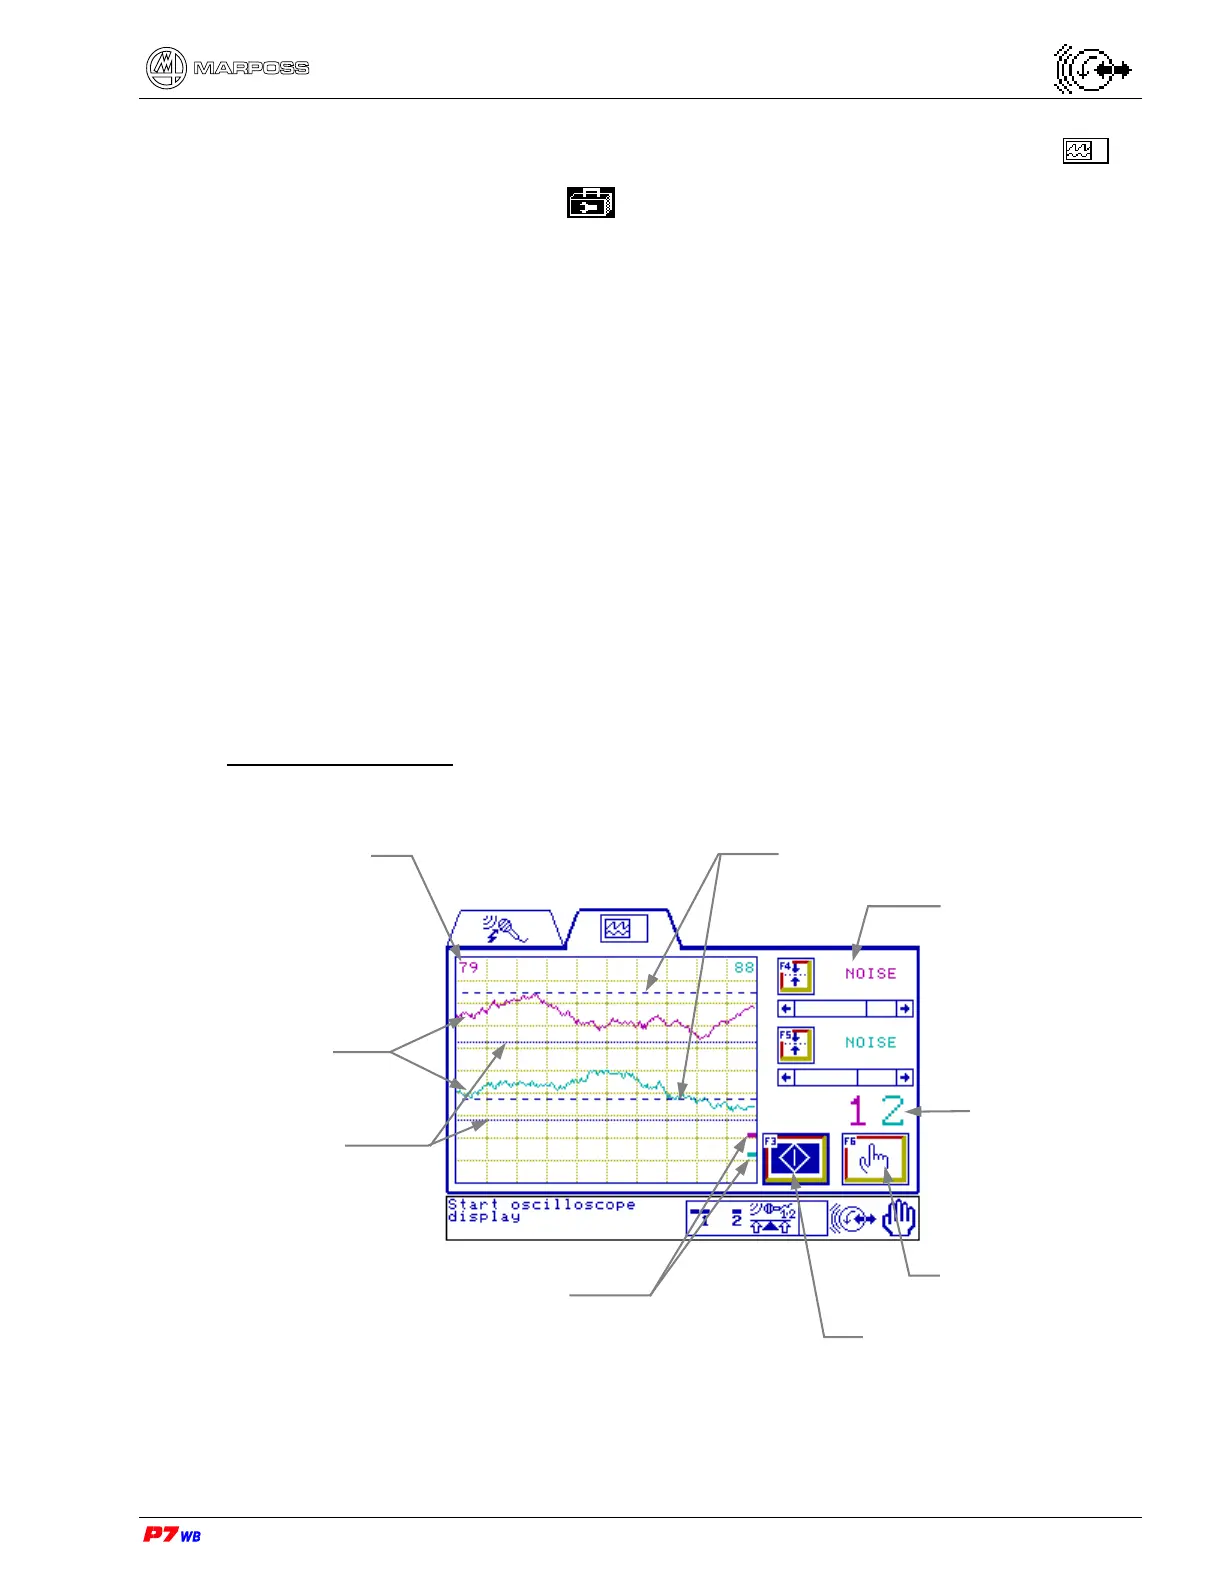
Gap&Crash graphic representation and dynamic set-up
Page D6 of the “Utilities” folder menu map (section 8.1, page 3).
Page emulating the oscilloscope function, in manual operating mode, for:
• viewing the noise signal coming from the acoustic sensor of each logical channel
(channel 1 and/or channel 2). The signal trace and the corresponding Gap (G) and
Crash (C) thresholds are displayed for each channel.
• programming / changing the Gap (G) and Crash (C) threshold values. The change
is displayed in real time (function possible only if the **User’s Password** was
typed when entering the page).
Note: In the following sample display screens we always consider an application
with two logical channels (channel 1 and channel 2): in the applications with
channel 1 only, all the indications relevant to channel 2 are not present.
With color-display the data and graphical representations relevant to the same
channel have the same color.
The Gap and Crash thresholds of the two channels differ in the graphic
representation modality (dotted line).
Oscilloscope function (example)
Data of the
selected control
Signal traces
Oscilloscope display
stop/start
Lo
ical channels
Gap/Crash thresholds
level of channel 2
Controls selection
Traces zero
Gap/Crash thresholds
level of channel 1
Numerical indication of
zero trace position