The Dashboard Tab provides access to a variety of gauges, meters and graphs that can be configured
to provide an at-a-glance graphical overview of application variables in real-time. A total of 10 gauge
windows are available (four at a time), and each gauge window can be configured to display any
register’s value via one of six different gauge types. User-defined engineering units, scaling and range
limits are also configurable. Refer to Figure 13.
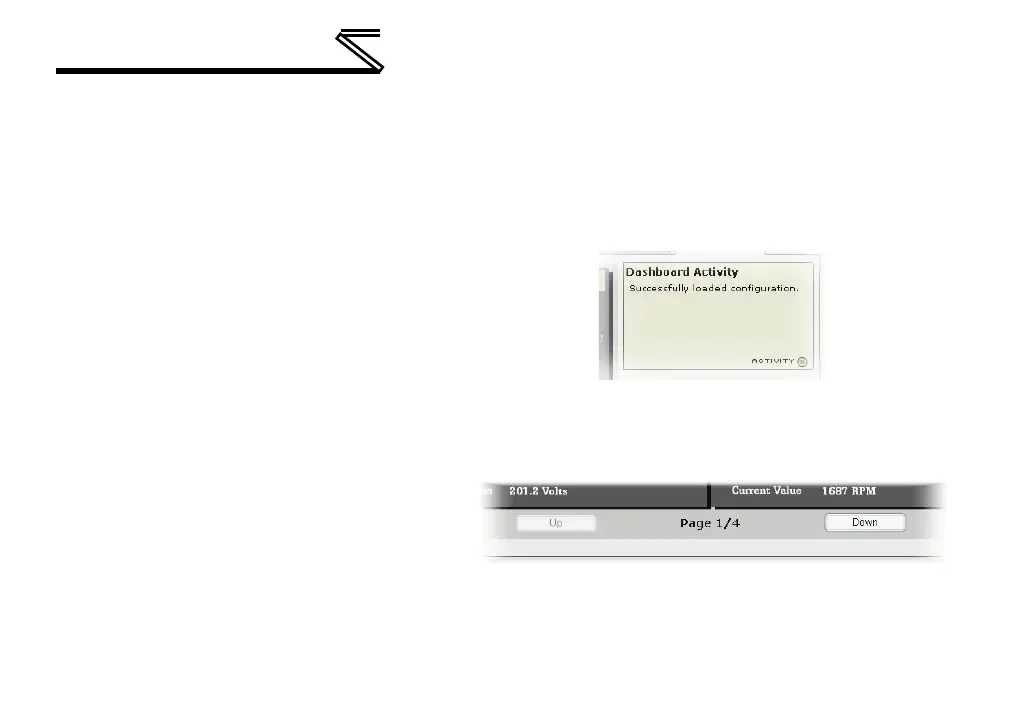
6.3.1 Information Window
Figure 14 shows the Information Window,
which displays messages regarding the
status of the Dashboard configuration
parameters (loading or submitting).
6.3.2 Gauge Window Navigation
Figure 15 shows the two buttons that provide
for navigation of the gauge windows. Clicking
the “Up” or “Down” buttons will scroll the
gauge windows.
Figure 14: Dashboard Tab Information Window
Figure 15: Gauge Window Navigation
 Loading...