134
Line Graphs Section 7-10
7-10 Line Graphs
7-10-1 Default Settings for Line Graphs
7-10-2 Overview of Line Graphs
Line Graph
Characteristics
Line graphs have the following characteristics.
• A single line graph part can display up to eight lines.
• For line graphs, either of two drawing modes can be selected: Data Log or
Broken-line Graph.
• Sampled values are saved in the history memory in the PT.
• The line graph data saved in the PT can be saved in CSV format using the
NV Memory Editor.
Refer to Appendix A NV Memory Editor for information on the NV Memory
Editor.
• Data can be sampled in up to five groups.
• Sampling can be started and stopped for each line graph sampling group.
Drawing Mode
■ Data Log
In this mode, data is read from the PLC into the internal memory of the PT at
specified intervals in one- or two-word units.
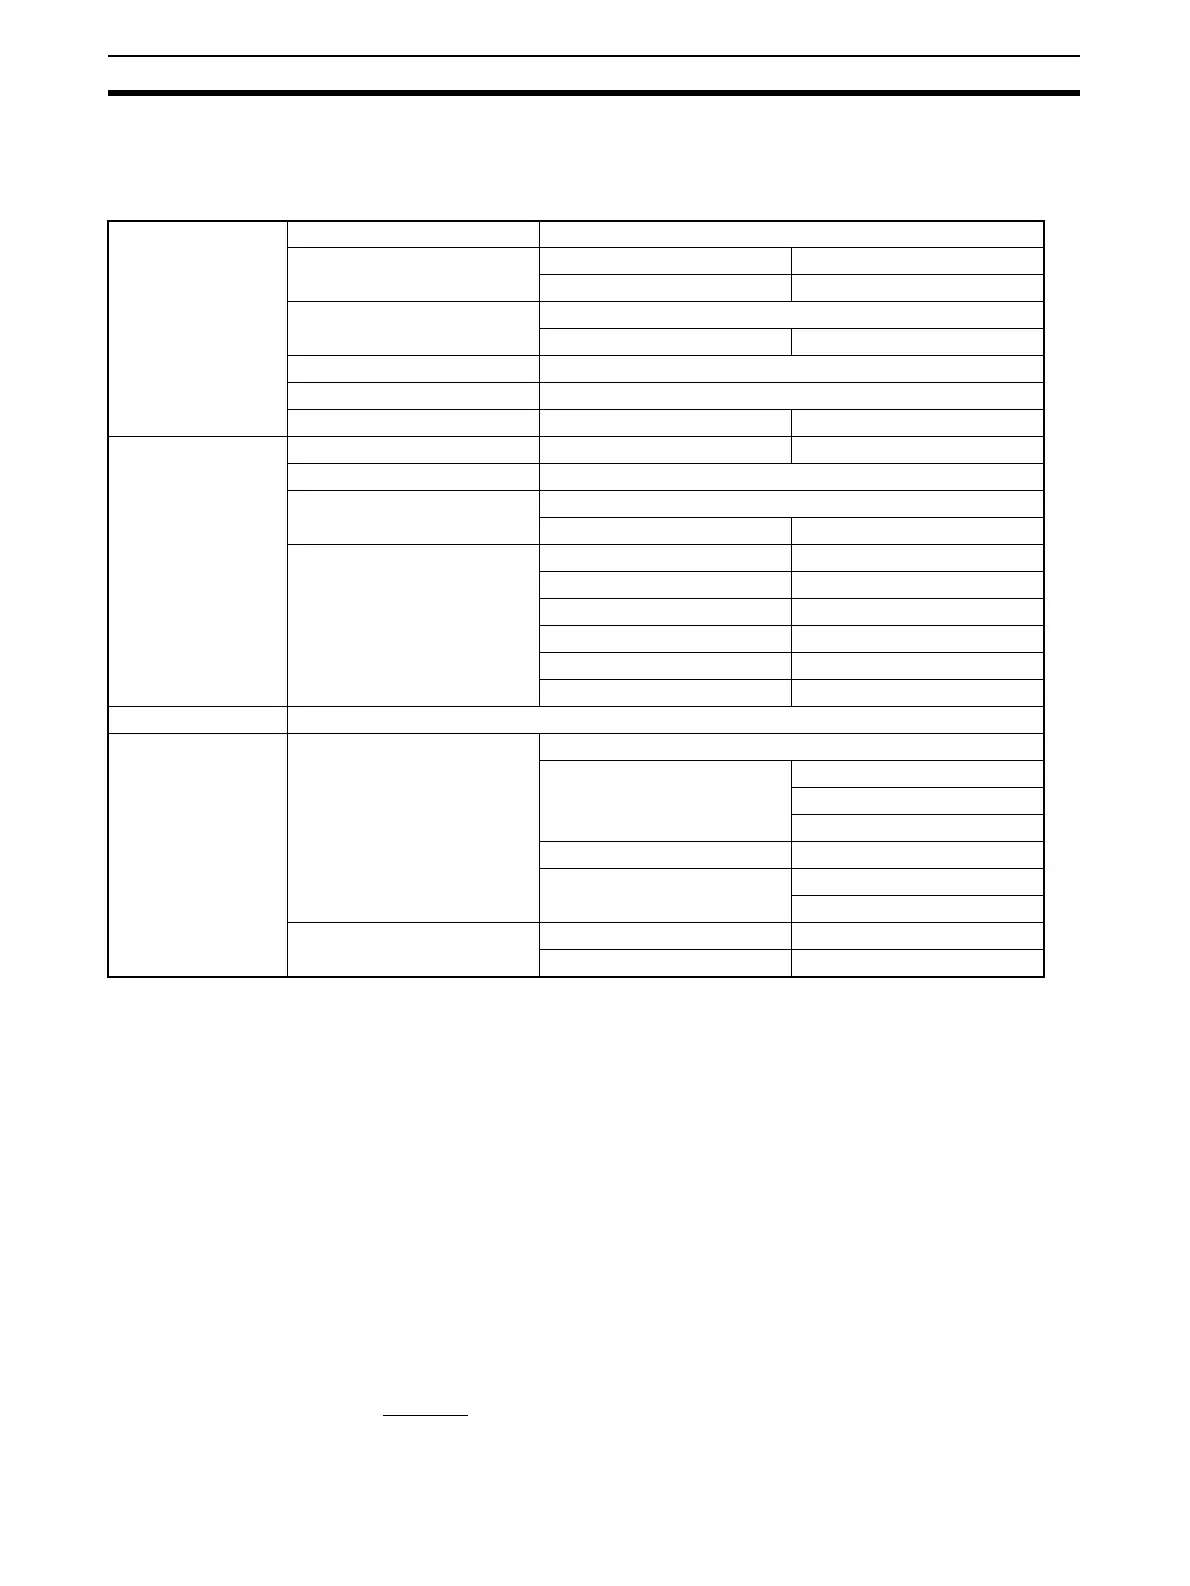
Basic Setup Function Data Log
Reference Group No. 0
Number of Lines 1
Graph Type Pen Move
Number of Scrolls 1
Direction Right
Stop Update Off
Display Point Display Point NV3W: 32, NV4W/NV3Q: 80
Display Display Data Plot Interval (Dot) 1
Background Color White
Display Frame Whole
Color Black
Scale Horizontal Line On
Number of Divisions 4
Color Black
Vertical Line On
Number of Divisions NV3W: 4, NV4W/NV3Q: 10
Color Black
Operation Security Off
Element Setup Line Settings Name
Line Type/Color/Mark Type: -
Color: Black
Mark: None
Data Format DEC 1W unsigned
Max./Min. Max.: 1 to 65,535
Min.: 0 to 65,534
Reverse/Blink Normal Off
When Condition is True Off