J-Link / J-Trace (UM08001) © 2004-2017 SEGGER Microcontroller GmbH & Co. KG
187
5.5 Multi-core debugging
J-Link / J-Trace is able to debug multiple cores on one target system connected to the
same scan chain. Configuring and using this feature is described in this section.
5.5.1 How multi-core debugging works
Multi-core debugging requires multiple debuggers or multiple instances of the same
debugger. Two or more debuggers can use the same J-Link / J-Trace simultaneously.
Configuring a debugger to work with a core in a multi-core environment does not
require special settings. All that is required is proper setup of the scan chain for each
debugger. This enables J-Link / J-Trace to debug more than one core on a target at
the same time.
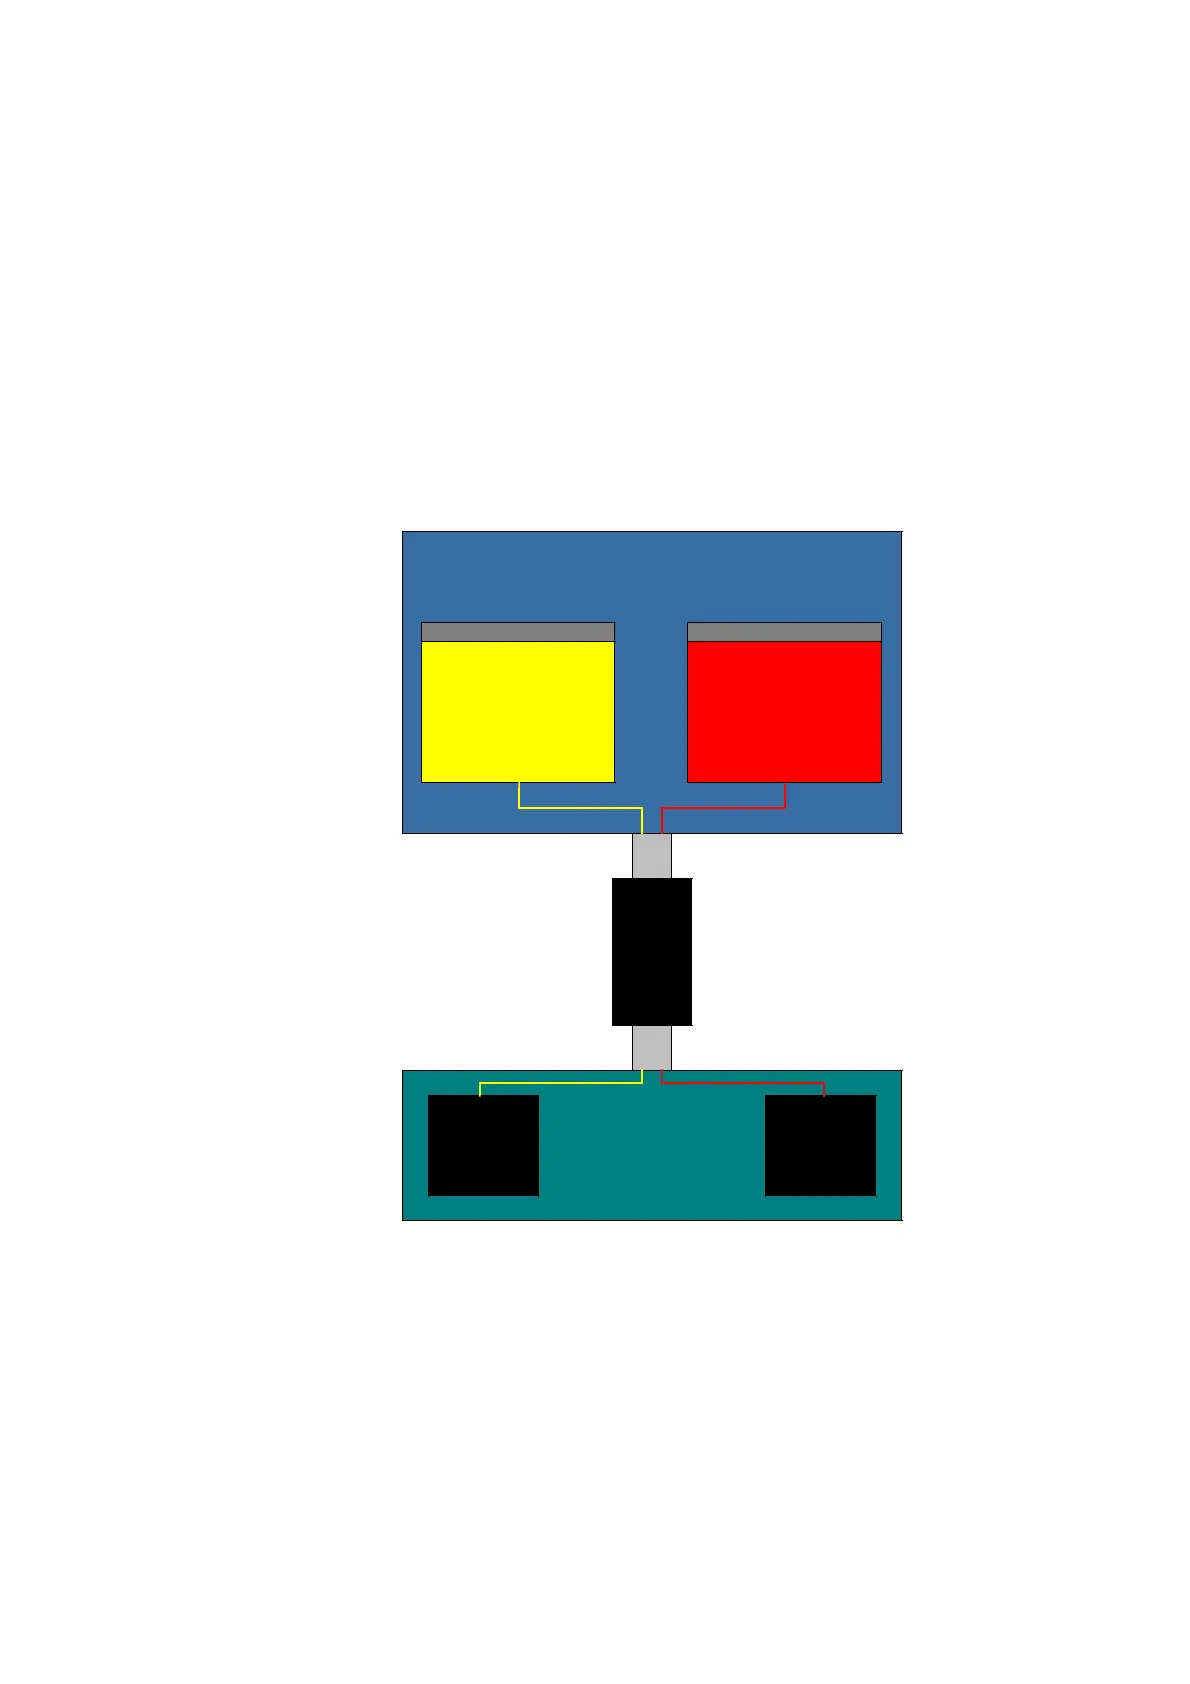
The following figure shows a host, debugging two CPU cores with two instances of the
same debugger.
Both debuggers share the same physical connection. The core to debug is selected
through the JTAG-settings as described below.
Host (PC)
Target hardware
CPU1
Debugger
Instance 2
Debugger
Instance 1
USB
JTAG
CPU0
J-Link