188 CHAPTER 5 Working with J-Link and J-Trace
J-Link / J-Trace (UM08001) ©
2004-2017 SEGGER Microcontroller GmbH & Co. KG
5.5.2 Using multi-core debugging in detail
1. Connect your target to J-Link / J-Trace.
2. Start your debugger, for example IAR Embedded Workbench for ARM.
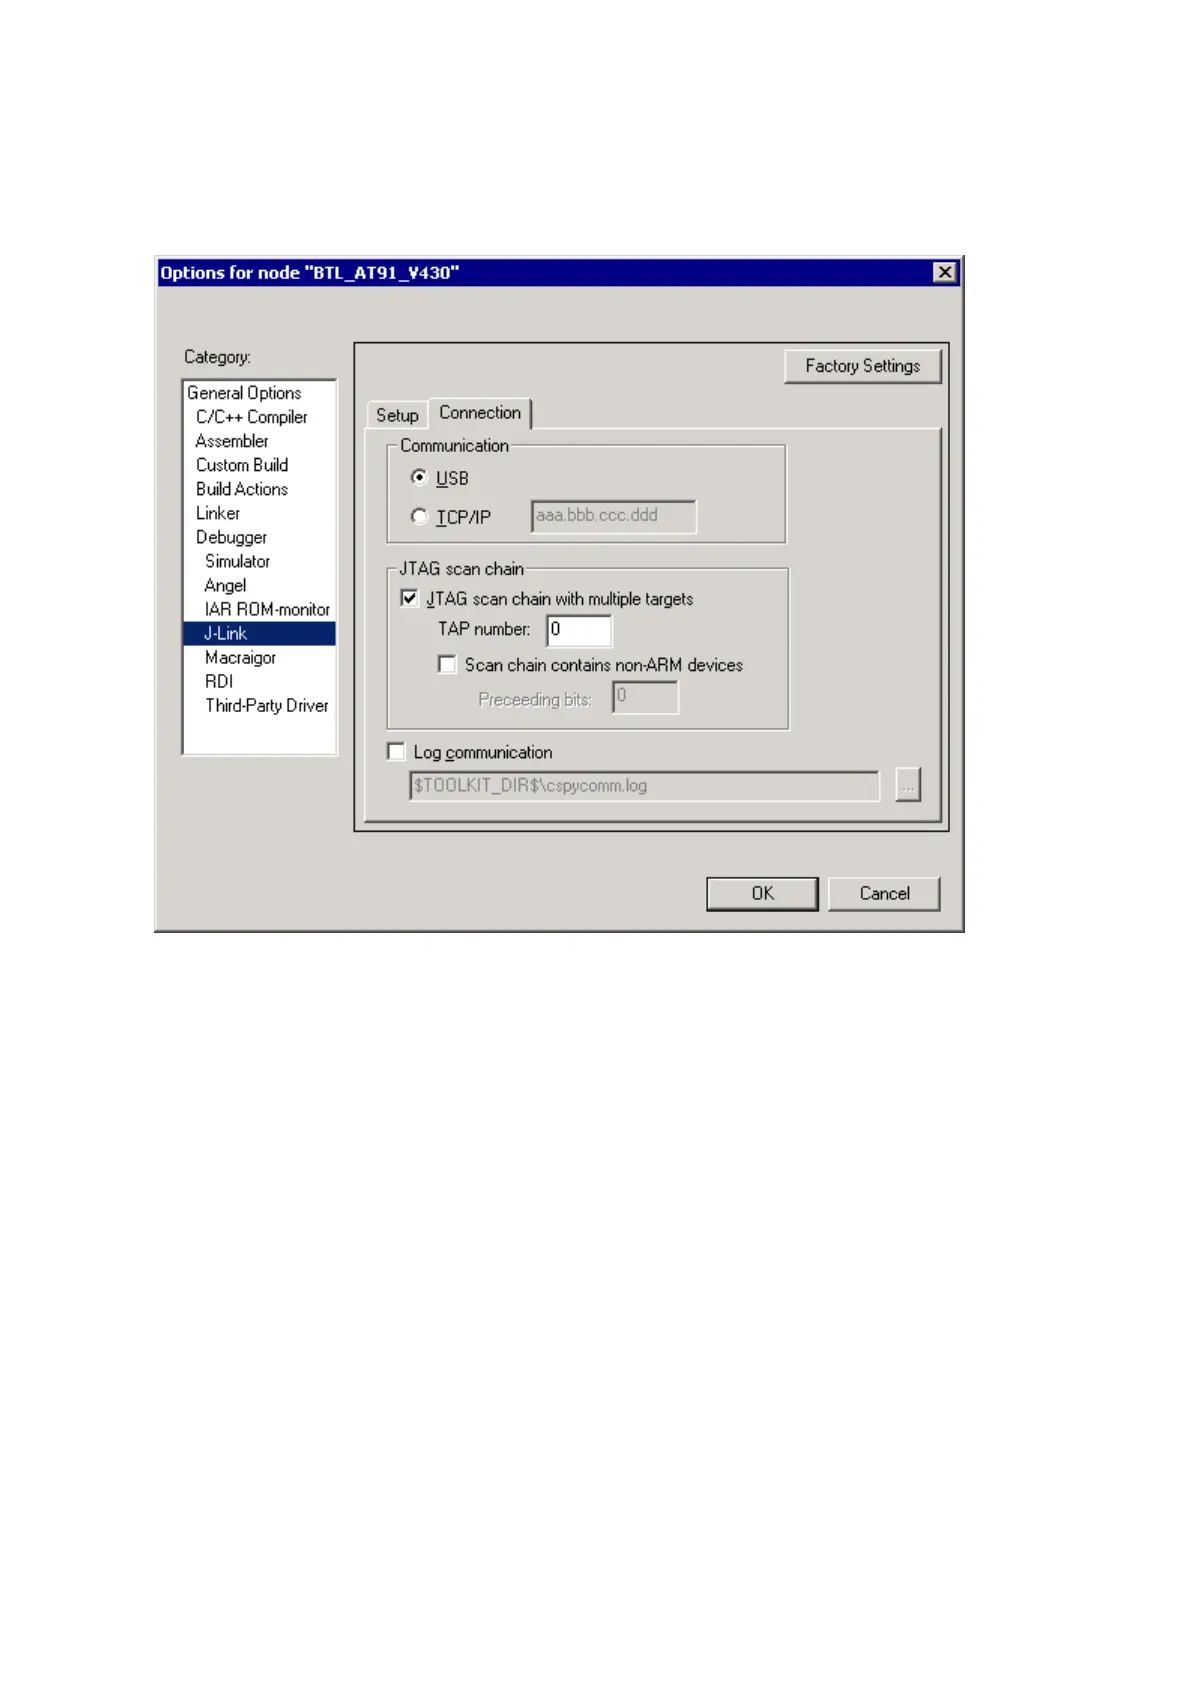
3. Choose Project|Options and configure your scan chain. The picture below
shows the configuration for the first CPU core on your target.
4. Start debugging the first core.
5. Start another debugger, for example another instance of IAR Embedded Work-
bench for ARM.