Trends4-10 SIMATIC PCS 7 OSx 4.1.2 Operator
4.2 Displaying Trend Data in a Graphic
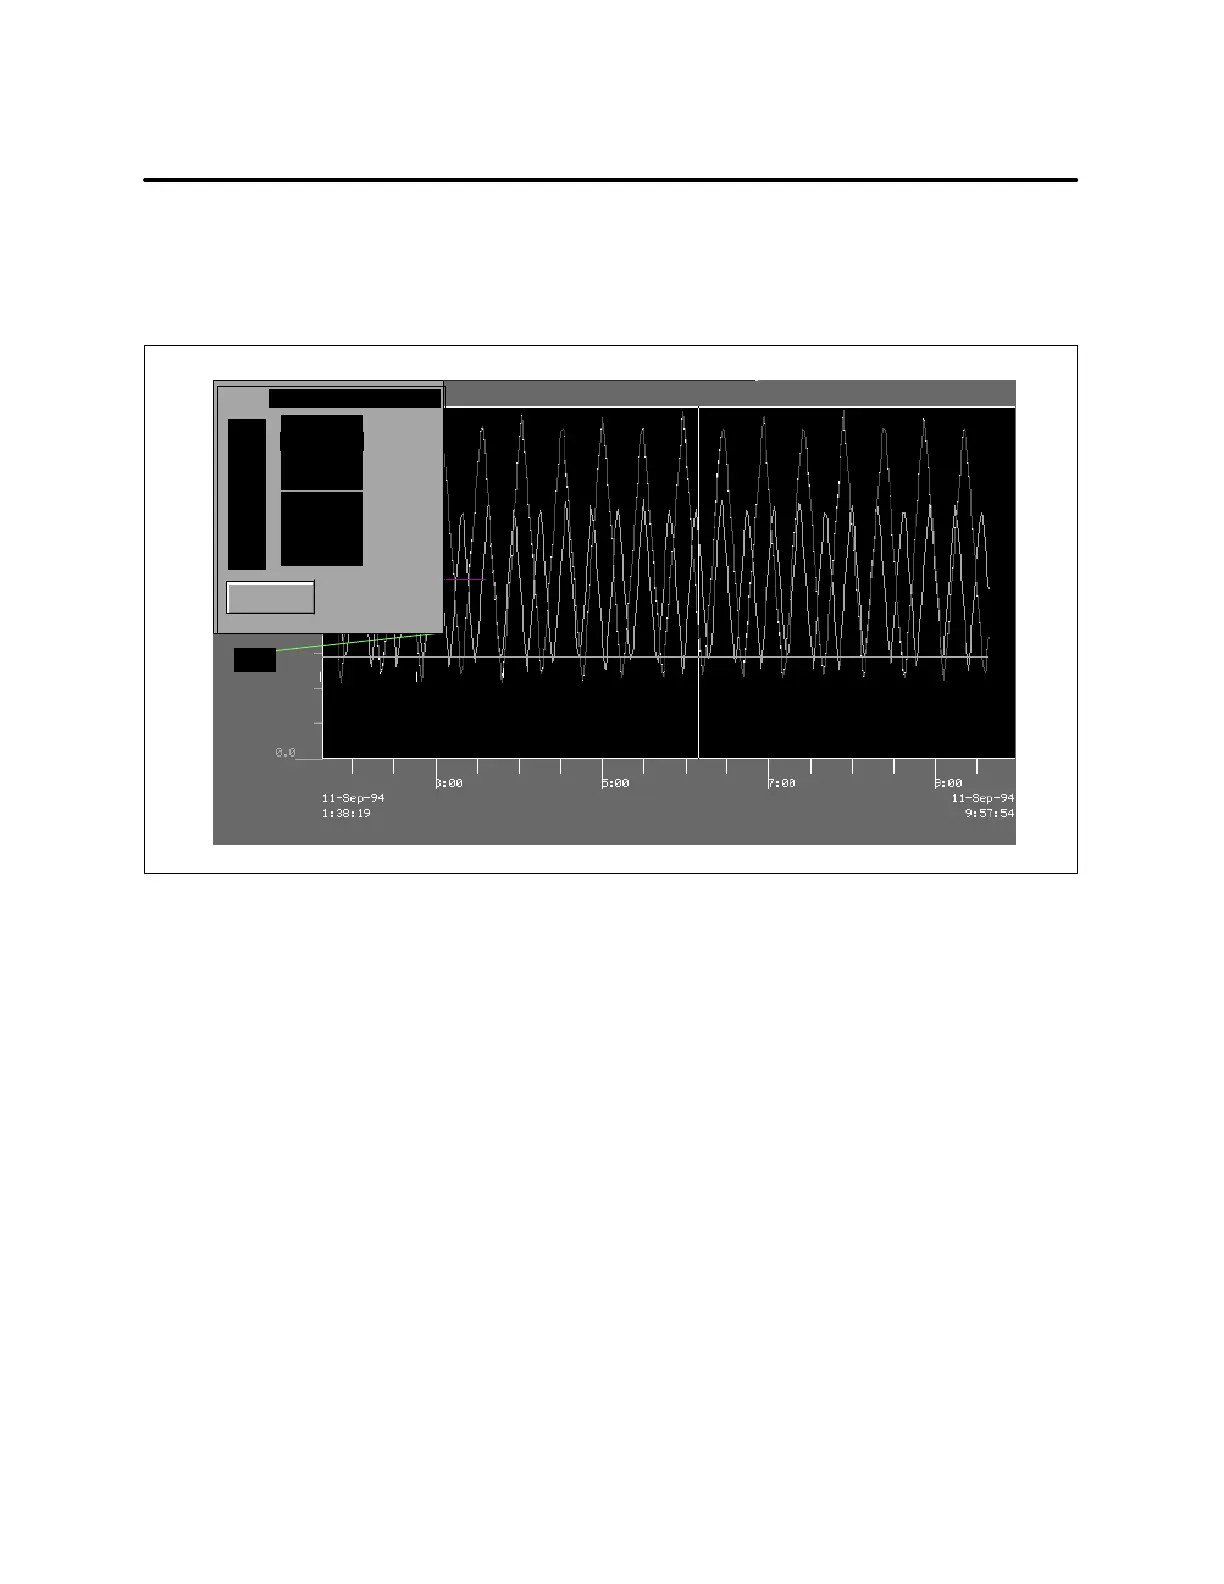
When the system is in the Operate state, the operator can display a trend in
a graphic, if one has been configured, and observe the trend plot. The
operator can click the trend line and display a box that shows exact values
at the selected time (Figure 4-6).
0.386218
0.656750
0.982500
0.374153
rtAI
1.8
0.5
0.0
47.00
47.30
48.00
14:50:49 16--Jun--98
0.000000
0.800000
0.150000
0.100000
0.900000
0.900000
0.000000
0.700000
-- --
-- --
-- --
-- --
-- --
-- --
-- --
-- --
DONE
Figure 4-6 Displaying Trend Data in a Graphic
 Loading...