With your mouse pointer, hover over a bar graph to display tool tip information about
satellite constellation, satellite number, and signal strength.
Letter Symbol GNSS Constellation
G GPS
R GLONASS
E Galileo
J QZSS
C BeiDou
I IRNSS
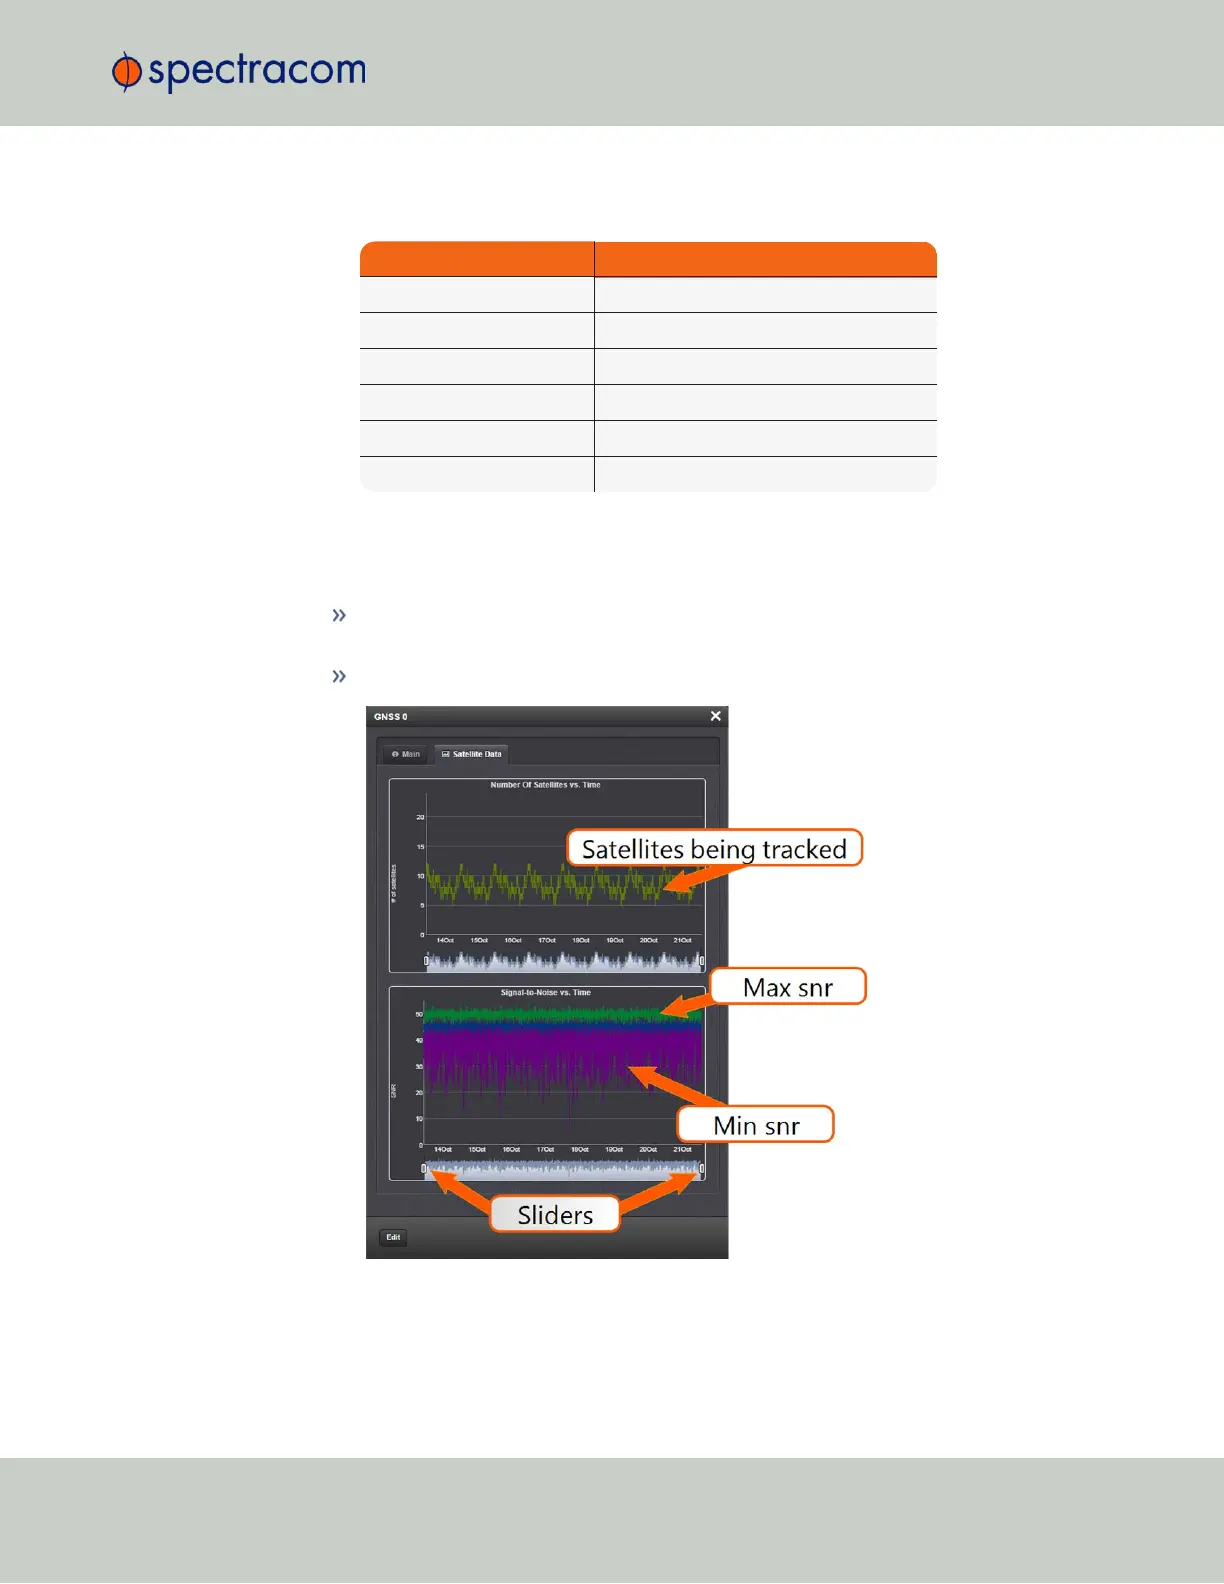
The "Satellite Data" tab
Under the Satellite Data tab, there are two graphs:
Number of Satellites over Time: A graphical track of how many satellites were being
tracked over time.
SNR over Time: A graphical track of maximum SNR, and minimum SNR.
In both graphs, to see a legend of the graphical data, and time-specific status data, click
inside the graph, choosing the desired point in time. If necessary, increase the time res-
olution by dragging the time sliders. A pop-up window will display the legend for that
3.3 Managing References
CHAPTER 3 • VersaSync User Manual Rev. 6.0
151