IT2200 Reader System with Multimode Capability Installation & Maintenance/Service Guide
5-8
5. Mount an IT2221 or IT2235 tag on the inside of the vehicle’s windshield. The tag
must be at least 5 cm (2 in) from the windshield frame or rear view mirror post,
and it must be below the tint line at the top of the windshield.
6. Park the vehicle with the tag exactly 3 m (10 ft) upstream of the antenna.
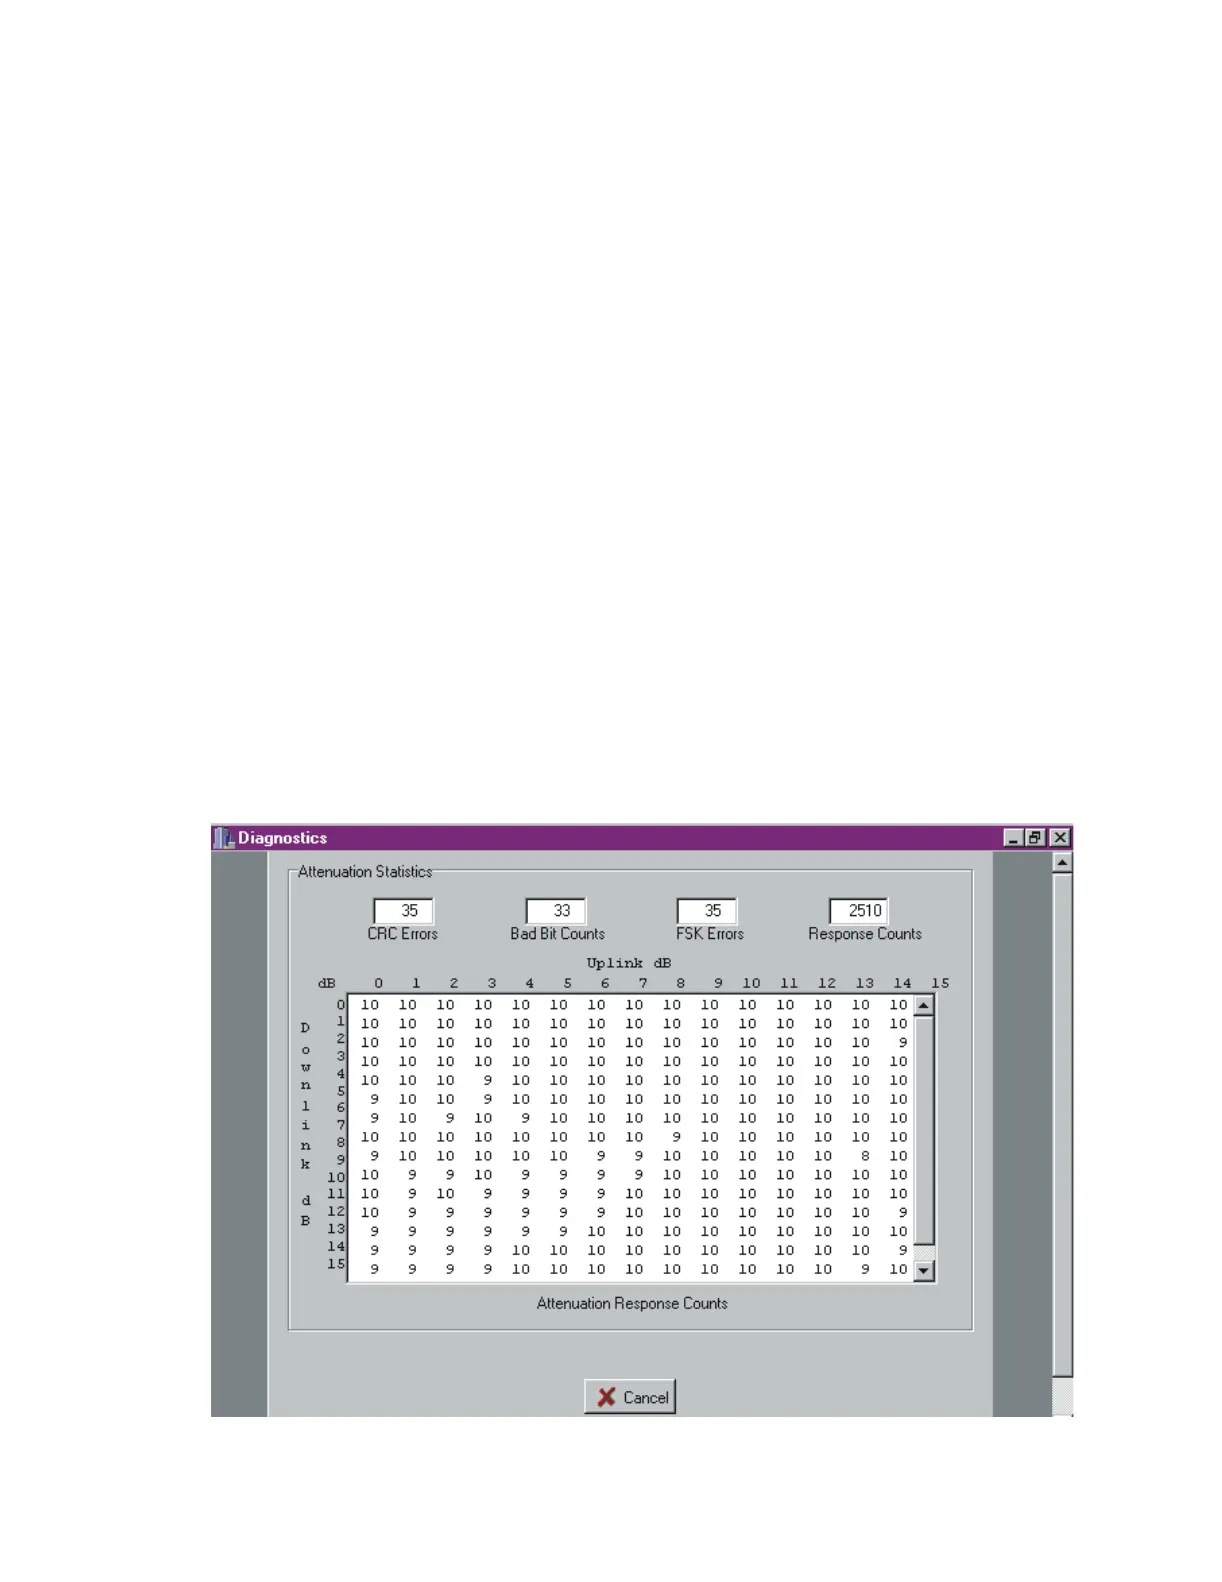
7. Run the attenuation statistics program (see Step 1 of this instructions section).
Save and label the tables.
8. Compare the attenuation statistics to those shown in Figure 5-3 and Figure 5-4.
Figure 5-3 shows an example of acceptable results. Notice that the screen shows
attenuation response counts of 9 or 10 at almost all attenuation settings. Figure 5-
4 shows attenuation response counts that range from acceptable to marginal to
unacceptable. If your results look like these, choose attenuation settings in the
acceptable range.
If the results are unacceptable, move the vehicle upstream 15 to 30 cm (6 to 12 in)
and repeat attenuation statistics. Then move the vehicle downstream of the
original position 15 to 30 cm (6 to 12 in) and repeat attenuation statistics. If
moving the vehicle results in a good report, the vehicle was in a small hole or poor
read area as a result of a standing wave pattern, and you can proceed with the
tuning.
If you are unable to achieve good attenuation statistics by moving the vehicle, go
to Chapter Chapter 6, “Troubleshooting the Installation.”
Figure 5-3 Acceptable RF Attenuation Statistics