Printing QC Results
AEROSET
®
Customer Training Guide 7-29
94858-103 — July 2003
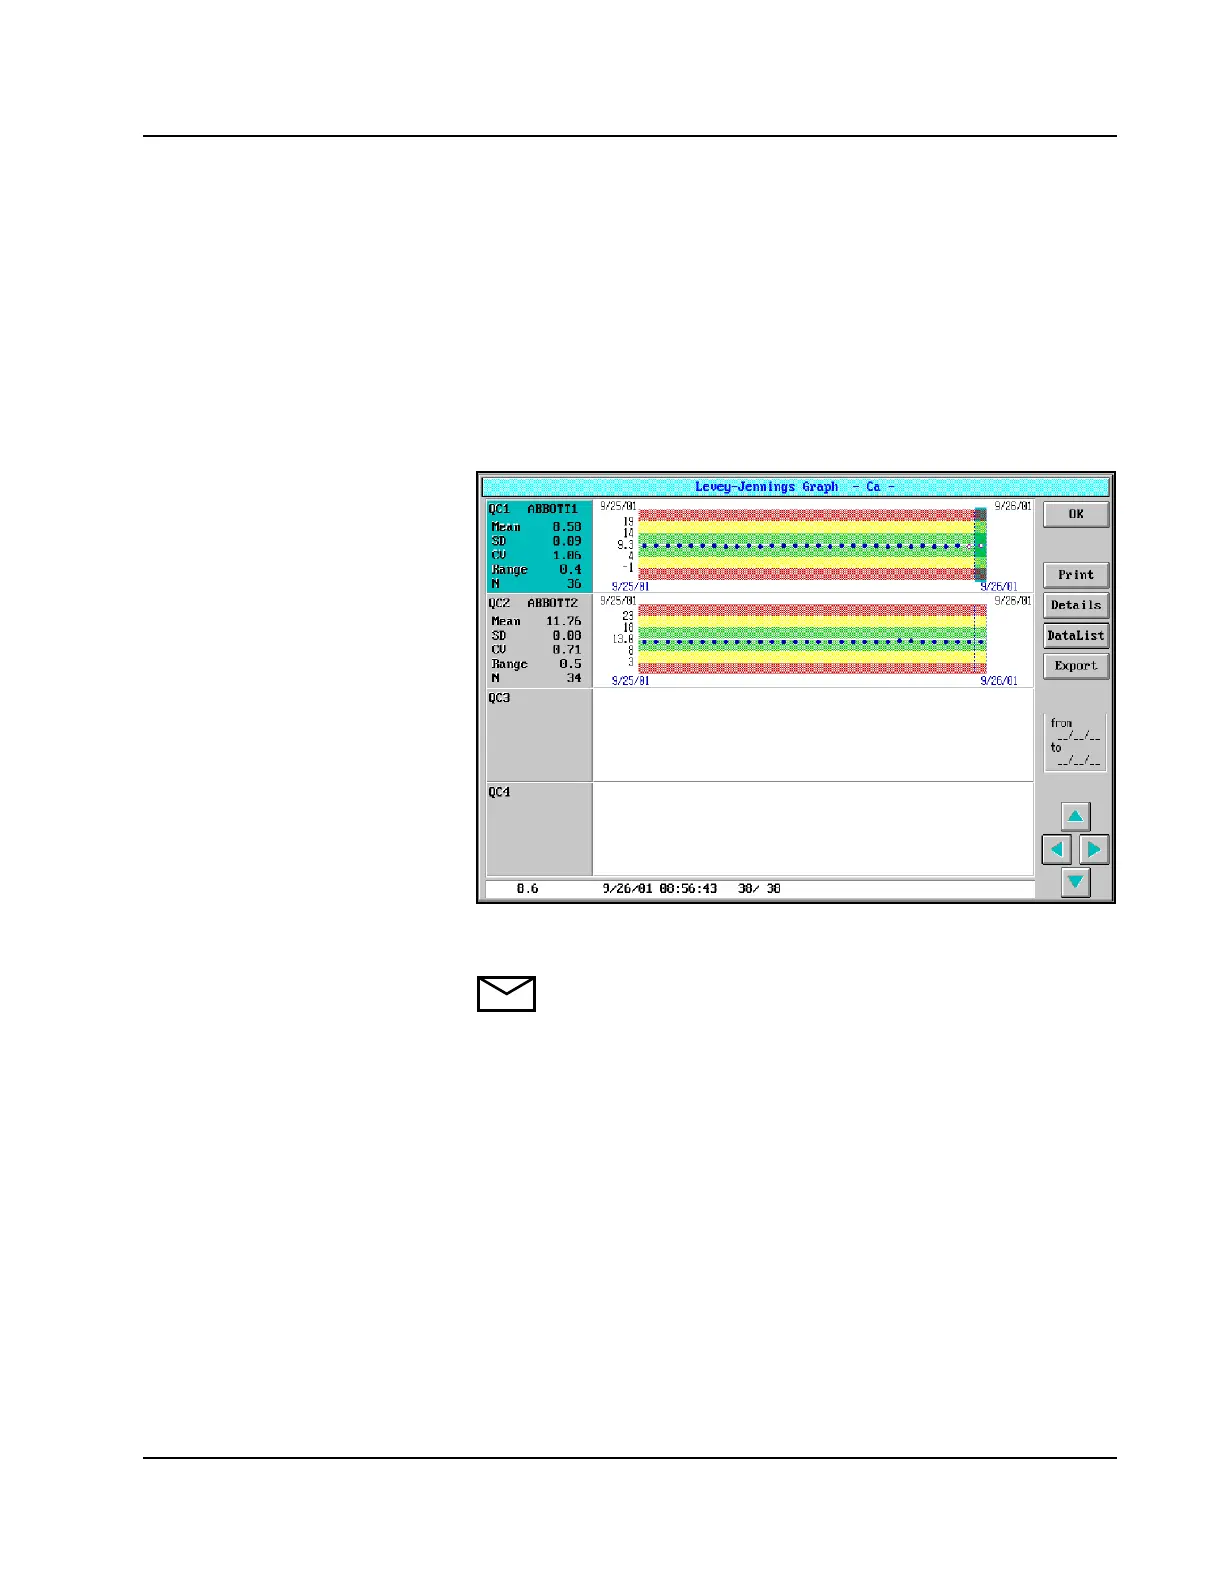
Levey-Jennings Graph Report
Use the following instructions to print the Levey-Jennings graph report.
1. Select <ASSAYS> in the Information Access Area of the Main
Display. The ASSAYS screen displays.
2. Select the assay name. The ASSAY STATUS screen displays.
3. Select <QC> in the right column of the screen. The
Levey-Jennings Graph screen displays.
Figure 7.15: Levey-Jennings Graph Screen
NOTE: The Levey-Jennings Graph screen can also be
accessed from the QC SUMMARY screen. Select the line that
displays the QC statistics of the selected assay then select <LJ
Graph> in the right column of the screen. The Levey-Jennings
Graph screen displays.