MODULE 7: QUALITY CONTROL
7-28 AEROSET
®
Customer Training Guide
94858-103 — July 2003
PRINTING QC RESULTS
There are three different report types available for printing QC data. For
examples of these QC reports, refer to Appendix B of the AEROSET
System Operations Manual.
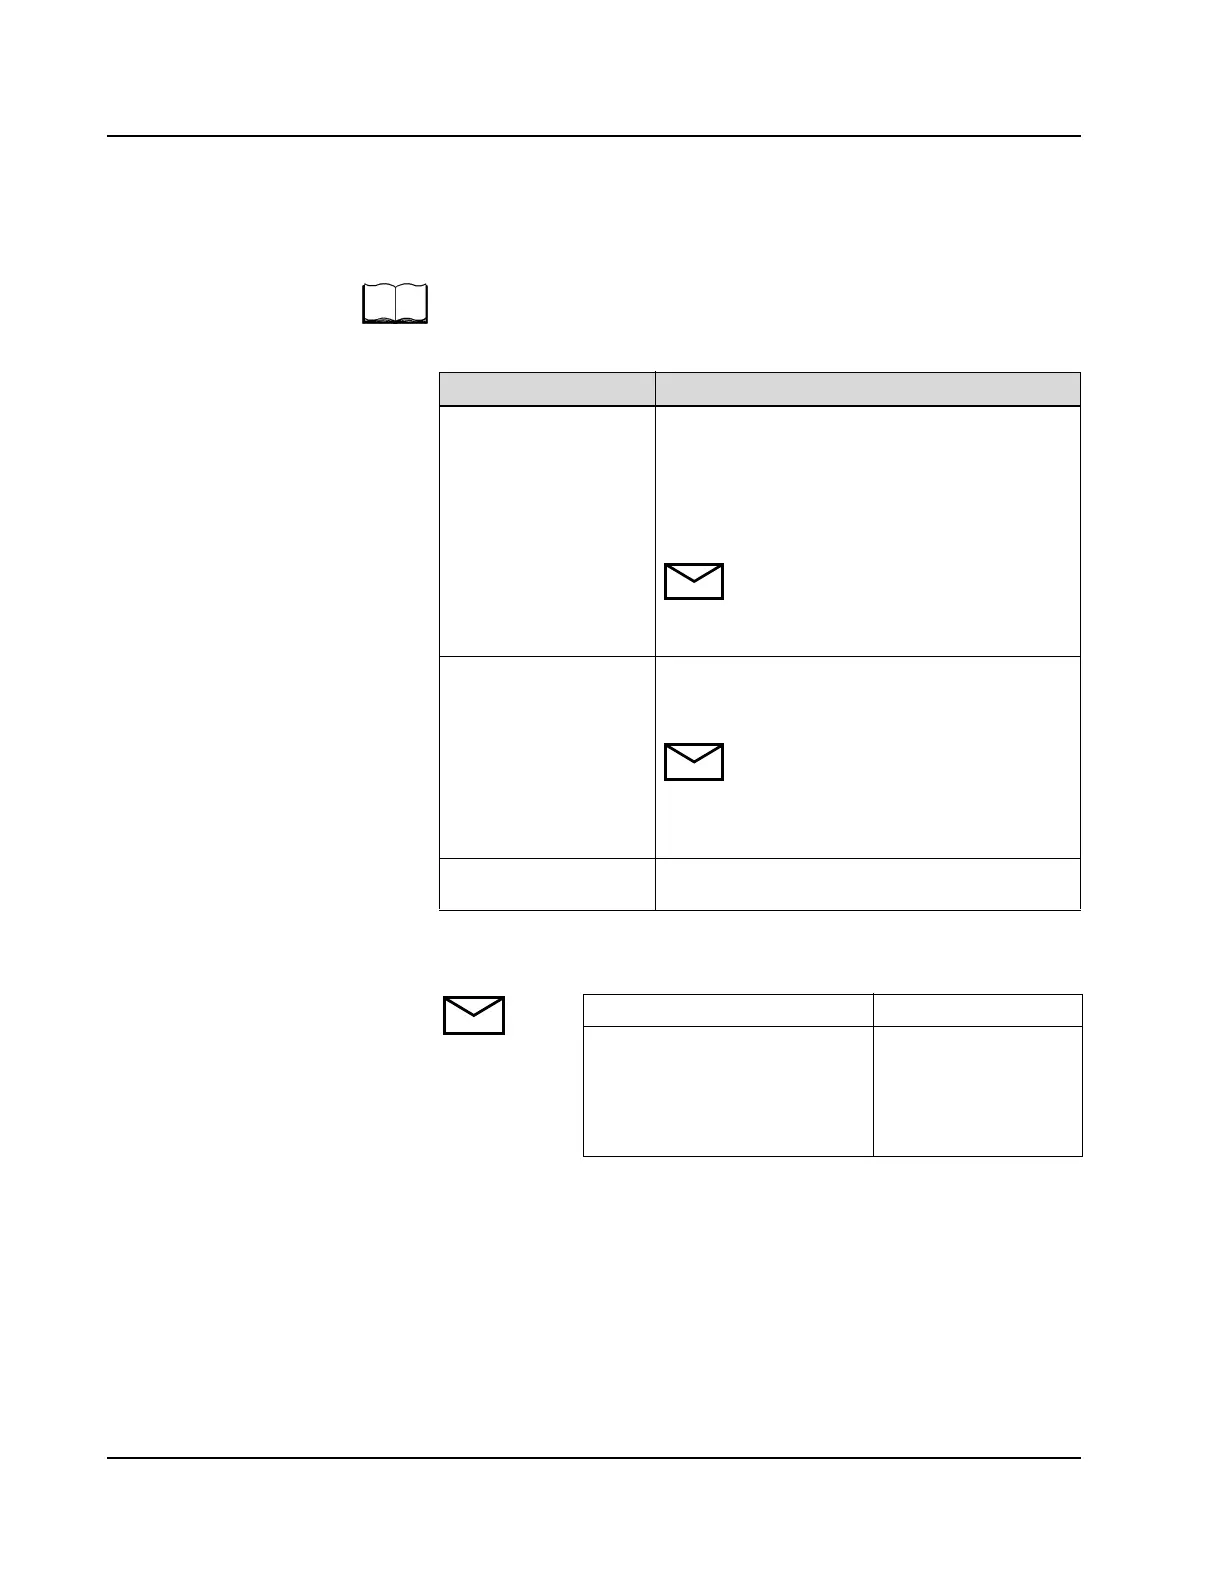
Report Type Description
Levey-Jennings Graph Each value is printed with the date completed and
is then plotted on the Levey-Jennings Graph that
prints vertically down the page. All included points
are plotted with an “*” and excluded values are
plotted with a “+”. The QC name and statistics are
printed at the top of the report.
NOTE: An “L” or “H” Flag is displayed
next to the result if the value is outside the
defined 2 SD range. A Result Error Code is
displayed if an error occurred for the result.
QC Data List Lists all QC values with the date aspirated. The QC
name and statistics are printed at the top of the
report.
NOTE: An “L” or “H” Flag is displayed
next to the result if the value is outside the
defined 2 SD range. A Result Error Code is
displayed if an error occurred for the result.
A “D” is displayed for excluded values.
QC Summary Prints the statistics displayed on the QC
SUMMARY screen.
NOTE:
If... Then
Enable Control Reports is selected
for Printer B (Form 2)
and the Reference Ranges option
on the PAGE SETUP screen is
selected for Form 2
Reference ranges printed
on the report are patient
reference ranges, not QC
ranges.