Reviewing ICT™ Calibration Information
AEROSET
®
Customer Training Guide 9-9
94858-103 — July 2003
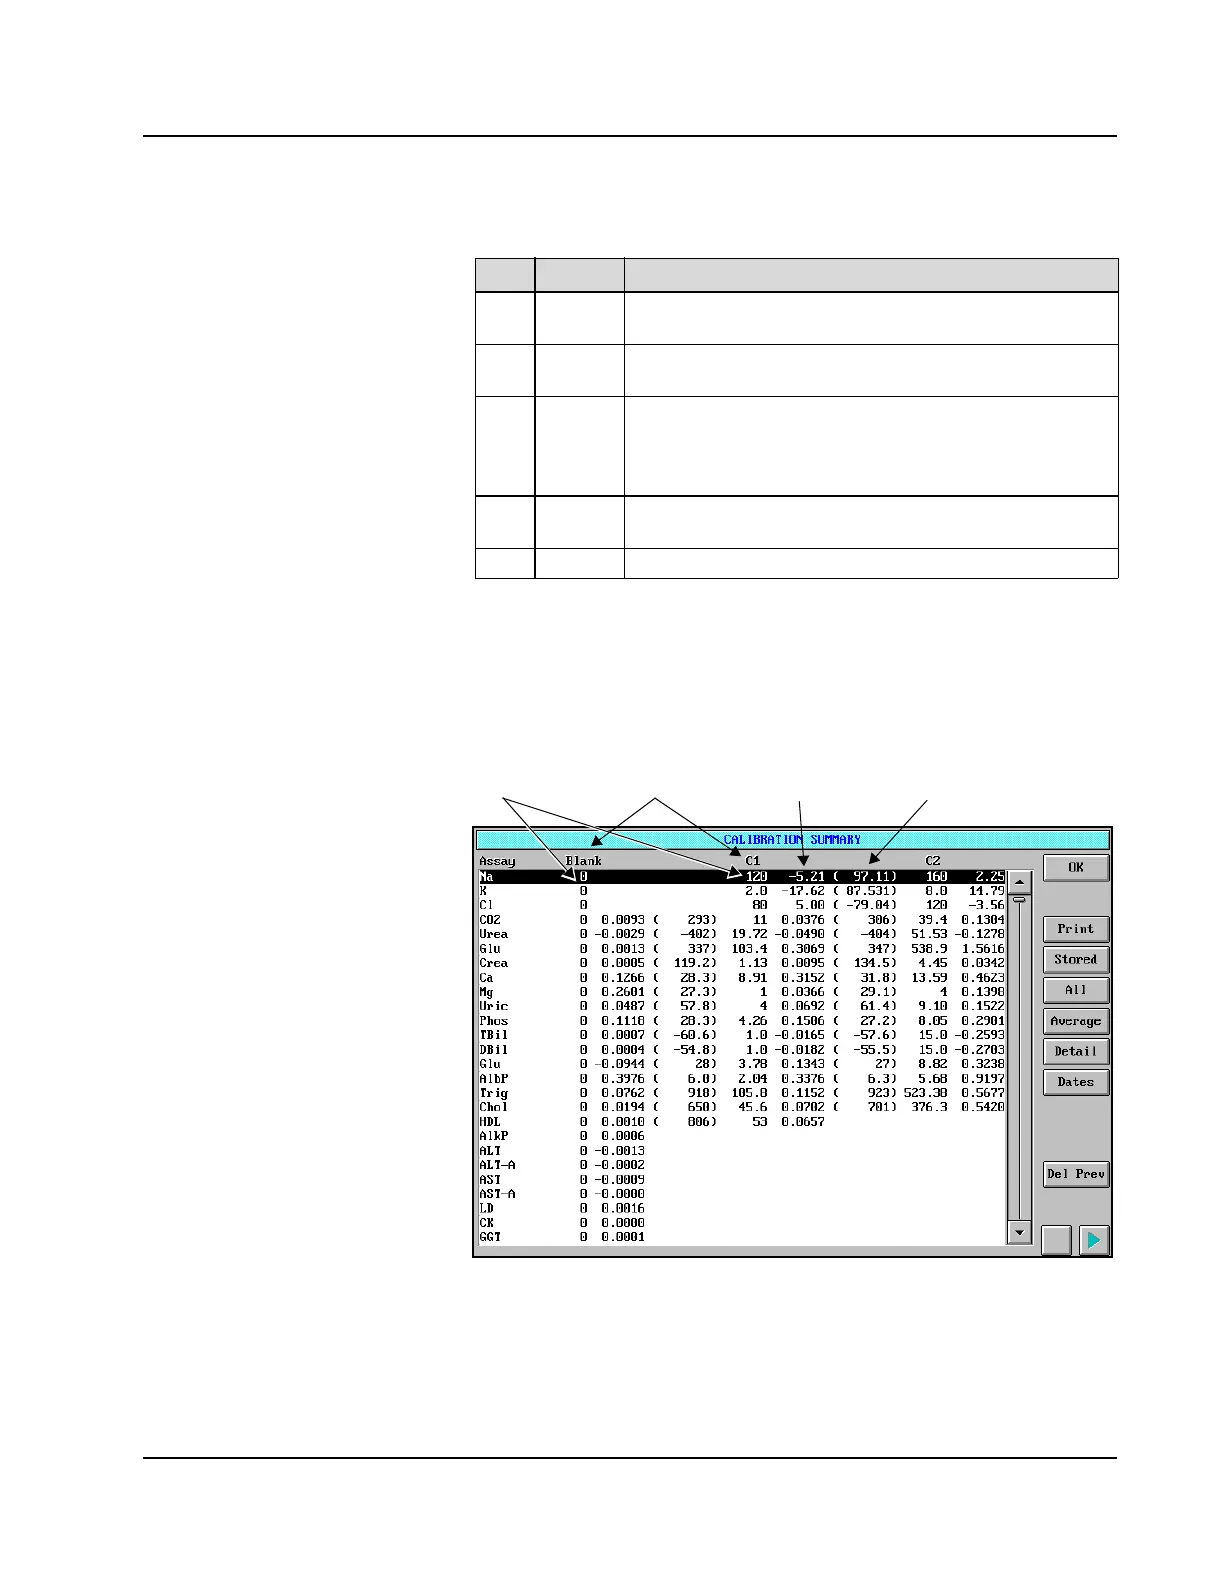
CALIBRATION SUMMARY Screen
The calibration data of the ICT assays are displayed on the
CALIBRATION SUMMARY screen.
Figure 9.3: CALIBRATION SUMMARY Screen
The data are displayed in the C1 and C2 columns. The mV readings and
slope are displayed rather than the absorbance and factors displayed for
the photometric assays.
Area Text Description
1
Graph Displays the actual calibration curve with a blue line. The
brown line indicates the 45% slope limit.
2
mV This column displays the measured mV (millivolt) values of
the Low and High Calibrators.
3
Slope This field displays the slope of the curve expressed in % of
ideal response. The slope is close to 100% when the ICT™
Module is new and decreases with time and use. The ICT
Module cannot be used with a slope of less than 45%.
4
Conc Calibrator concentration configured in the
CALIBRATOR/CONTROL screen.
5
Idx This area of the screen is not used.
Columns from left to right
are:
• Expected calibrator value (C1)
• Millivolt reading
• Slope
• Expected C2 calibrator value
• Millivolt reading
Concentration Calibrator Millivolt reading Slope