2. The display splits into two screens. After setup
has been completed (see step 3), the top shows
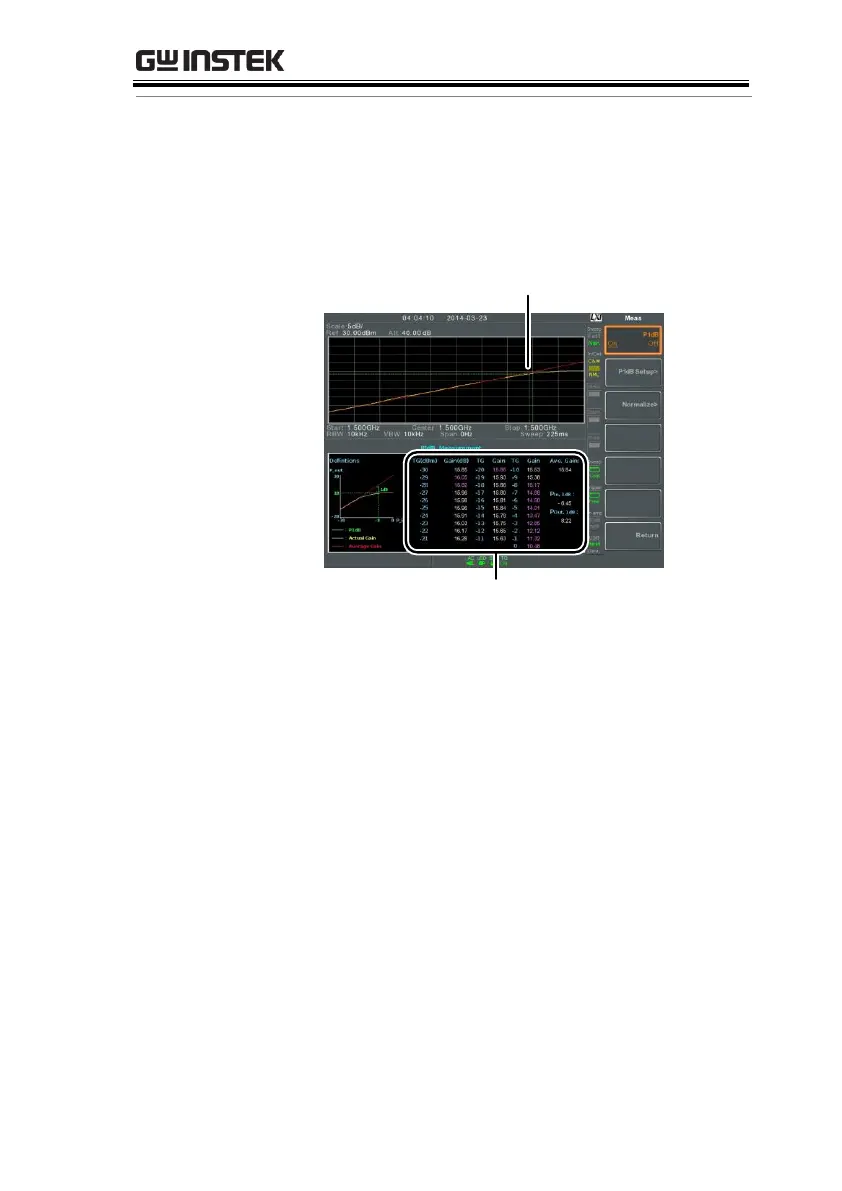
the trace (yellow) with the ideal response in
red. The P1dB measurement is shown in green.
The bottom screen shows the P1dB
measurement results in real time.
The measurement results display a total of 31
points, incremented in 1dB steps from -30dBm
to 0 dBm. In each column the left side shows
the input power and the right side shows the
gain. Gain marked in white is effective gain,
while gain marked in purple is ineffective gain.
The results also list the average gain, the output
power at the P1dB point (Pout, 1dB) and the
input power at the P1dB point.
 Loading...