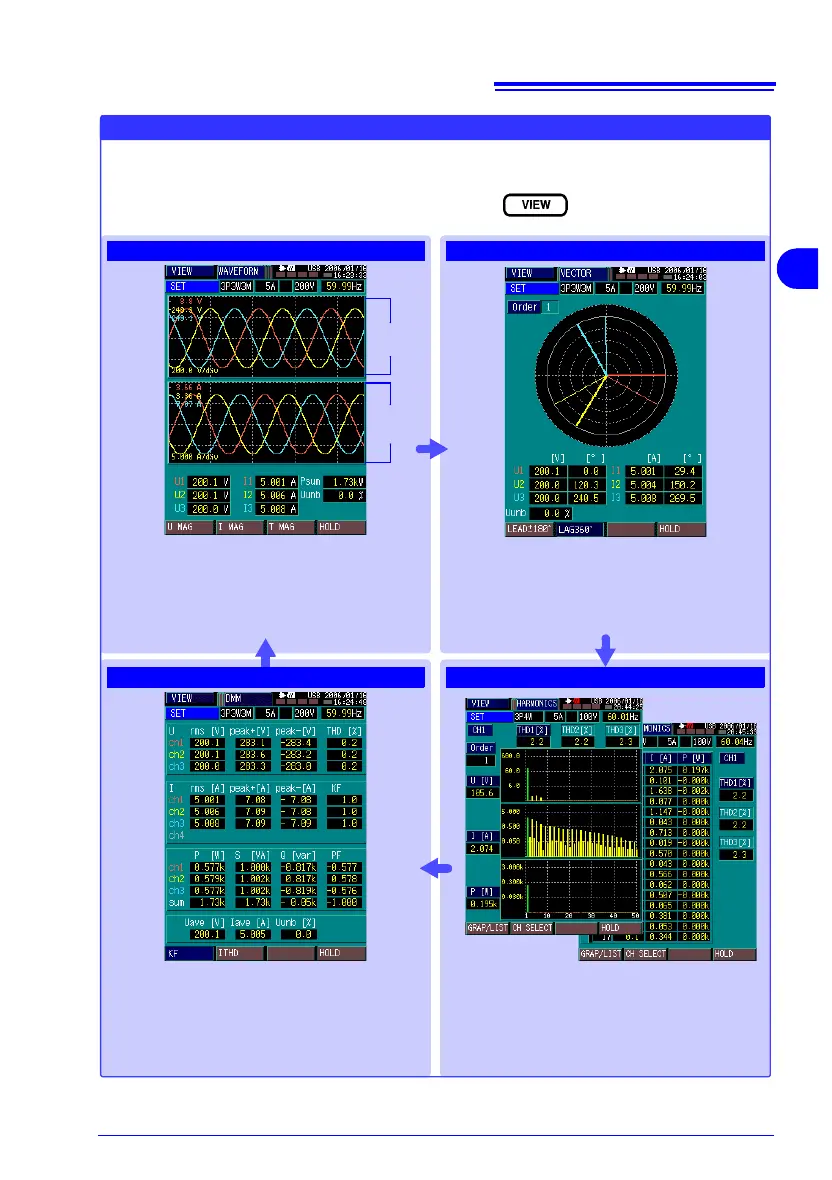
[WAVEFORM]
[VECTOR]
[DMM]
[HARMONICS]
VIEW (View Measurement Results)
The displayed screen changes each time you press
This screen displays voltage and current wave-
forms, and numerical voltage amplitudes, cur-
rent amplitudes and the time axis setting.
Cursor values can be displayed, and screen re-
freshing can be paused by the HOLD function.
This screen displays a voltage and current vec-
tor diagram. Voltage amplitudes, current ampli-
tudes and phase angles are displayed
numerically. Phase angle display can be
switched ±180° leading or 360° lagging. Screen
refreshing can be paused by the HOLD function.
This screen displays the results of harmonic
waveform measurements of voltage, current
and active power to the 50th order. The func-
tion keys switch between bar graph and numer-
ical value list displays.
This screen displays the following numerical
measurement results for each measurement
channel: voltage and voltage waveform peak
values, THD value, current and current wave-
form peak values, K factor, active power, appar-
ent power, reactive power and power factor.
Shows instaneous measurement results.
Current
waveform
Voltage
waveform