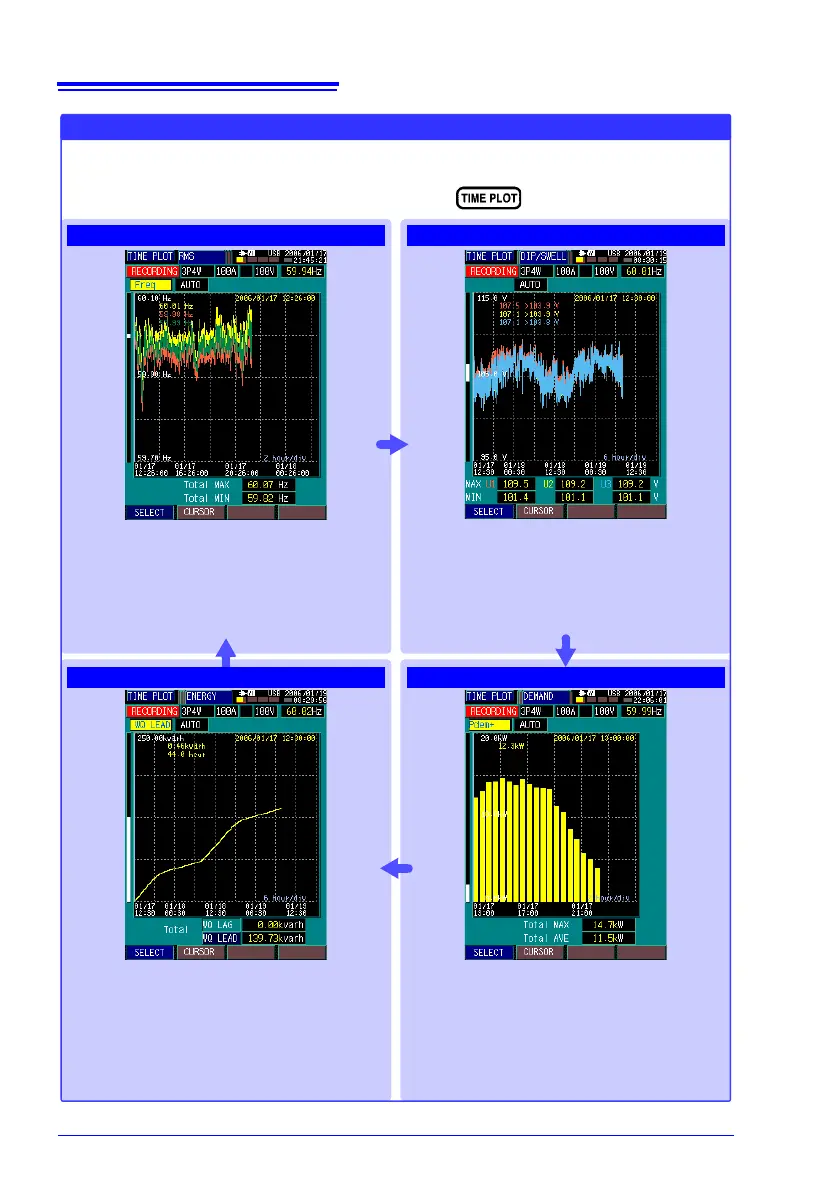
[RMS]
[DIP/SWELL]
[ENERGY]
[DEMAND]
TIME PLOT (Viewing Time Series Graphs)
The displayed screen changes each time you press
Various calculated rms values are displayed in a
time series graph with maximum, minimum and
average values during every interval. Displayed
parameters can be selected from voltage; cur-
rent; voltage and current waveform peak values;
frequency; active, reactive and apparent power;
power factor; THD and voltage unbalance factor.
Calculated rms voltage for one waveform shift-
ed by one-half cycle is displayed as a time se-
ries graph. Minimum and maximum values
within each period and over the whole mea-
surement period are displayed.
Graphically displays demand values (the average
power [kW] consumed during the "demand peri-
od" used in power company transactions) for
each specified demand period. The maximum
value within each period (maximum demand
power) and average value within each period and
over the whole measurement period are also dis-
played.
Energy consumption values of active power
[kWh] or reactive power [kvarh] are displayed
as a time series graph. Energy consumption
values for consumption/regeneration and lag/
lead can be displayed.
Displays recording state and recorded results as a fluctuation graph.