NORMAL OPERATION
Part. No. 2400M2501_6 Touchpoint Pro
109 Technical Handbook
13.5.2 Active Event History
The Active Events screen lists the current event history in the order that the events occurred, and in colour (Red, Yellow,
Orange and Grey) to highlight the severity. TPPR has the option to filter the history into categories, and this is described in
Ch. 14.8 Responding to Alarms, Faults and Warnings.
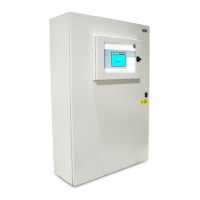
13.5.3 Touchscreen Layout
The two main Touchscreen displays are shown in the figure below. The top row shows touch sensitive icons as described in
Ch.24 Table of Icons.
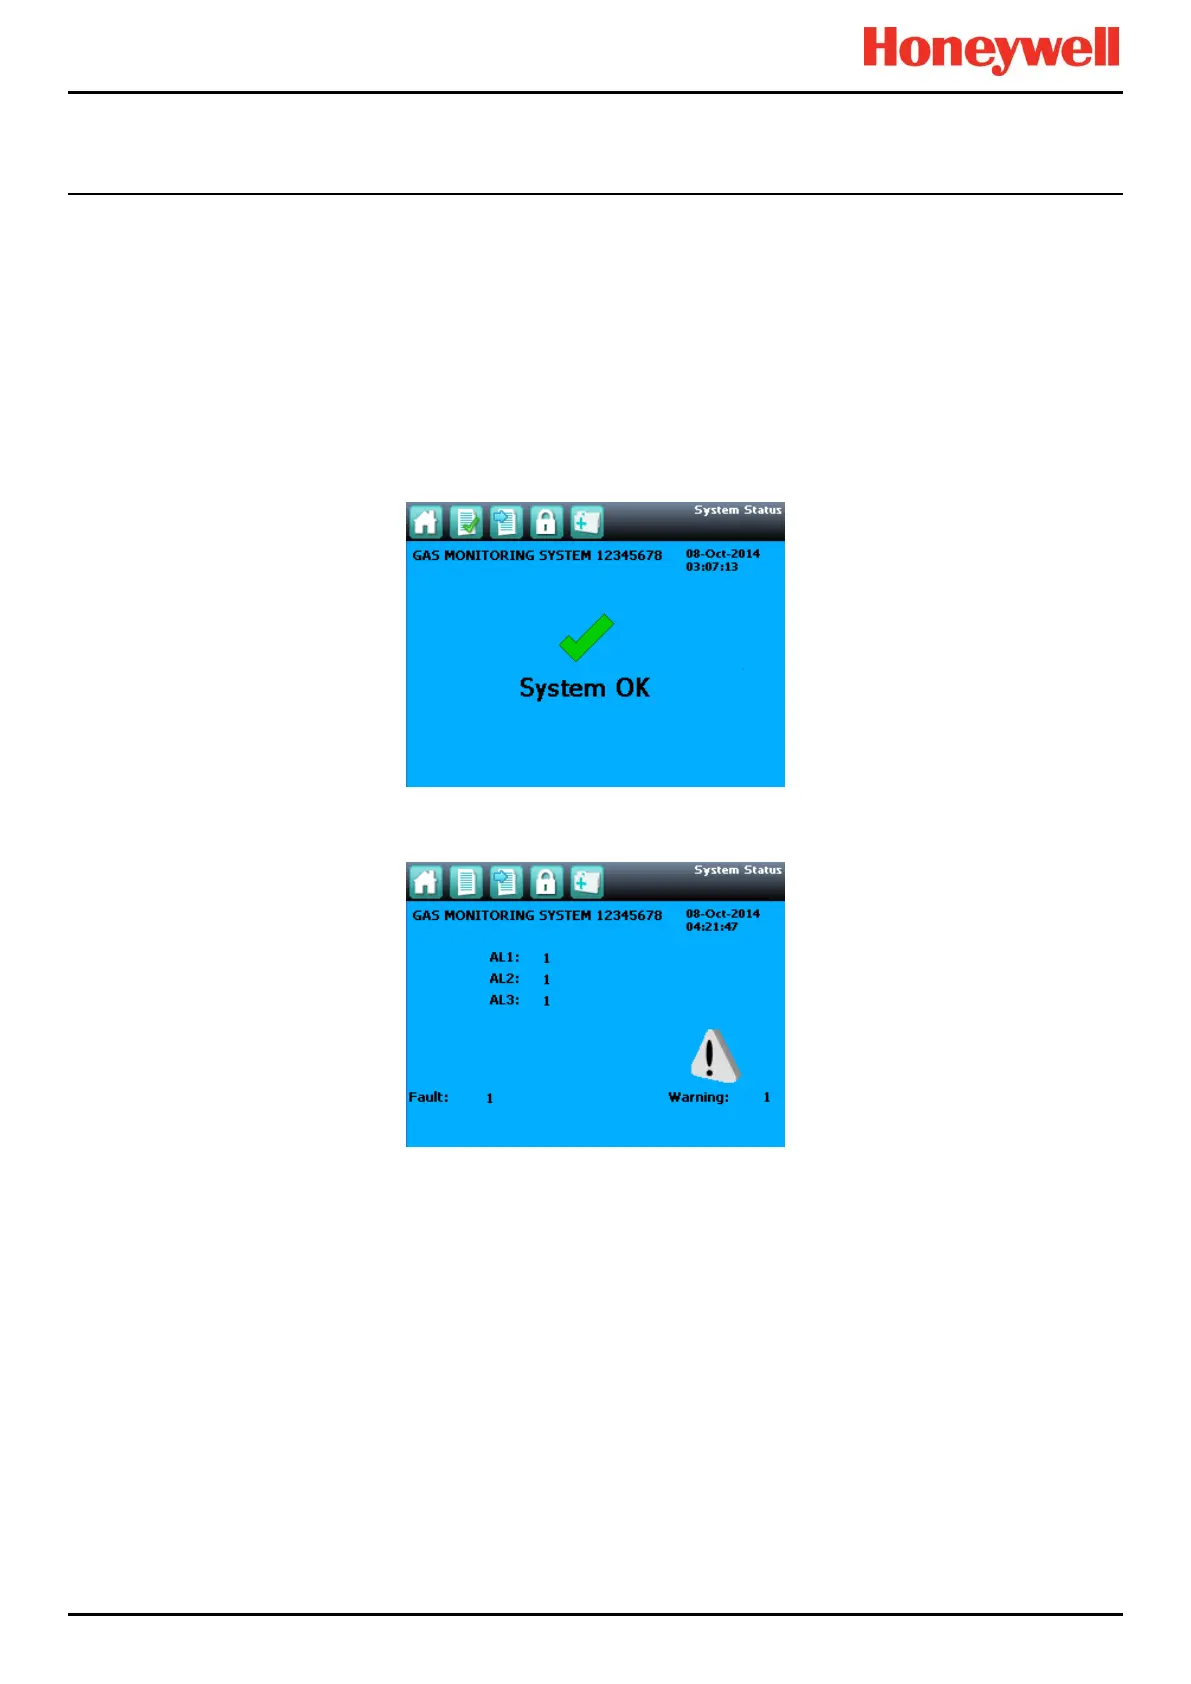
Figure 85 may be accompanied by external beacons, sounders and other events depending on your system setup. You can
touch each of the alarms, faults or warnings to identify the cause and to acknowledge them as described later.
Figure 84. System Status Normal
Figure 85. System Status with Example Active Events
 Loading...