3
3 – 60
3.3
Check of the receiving system
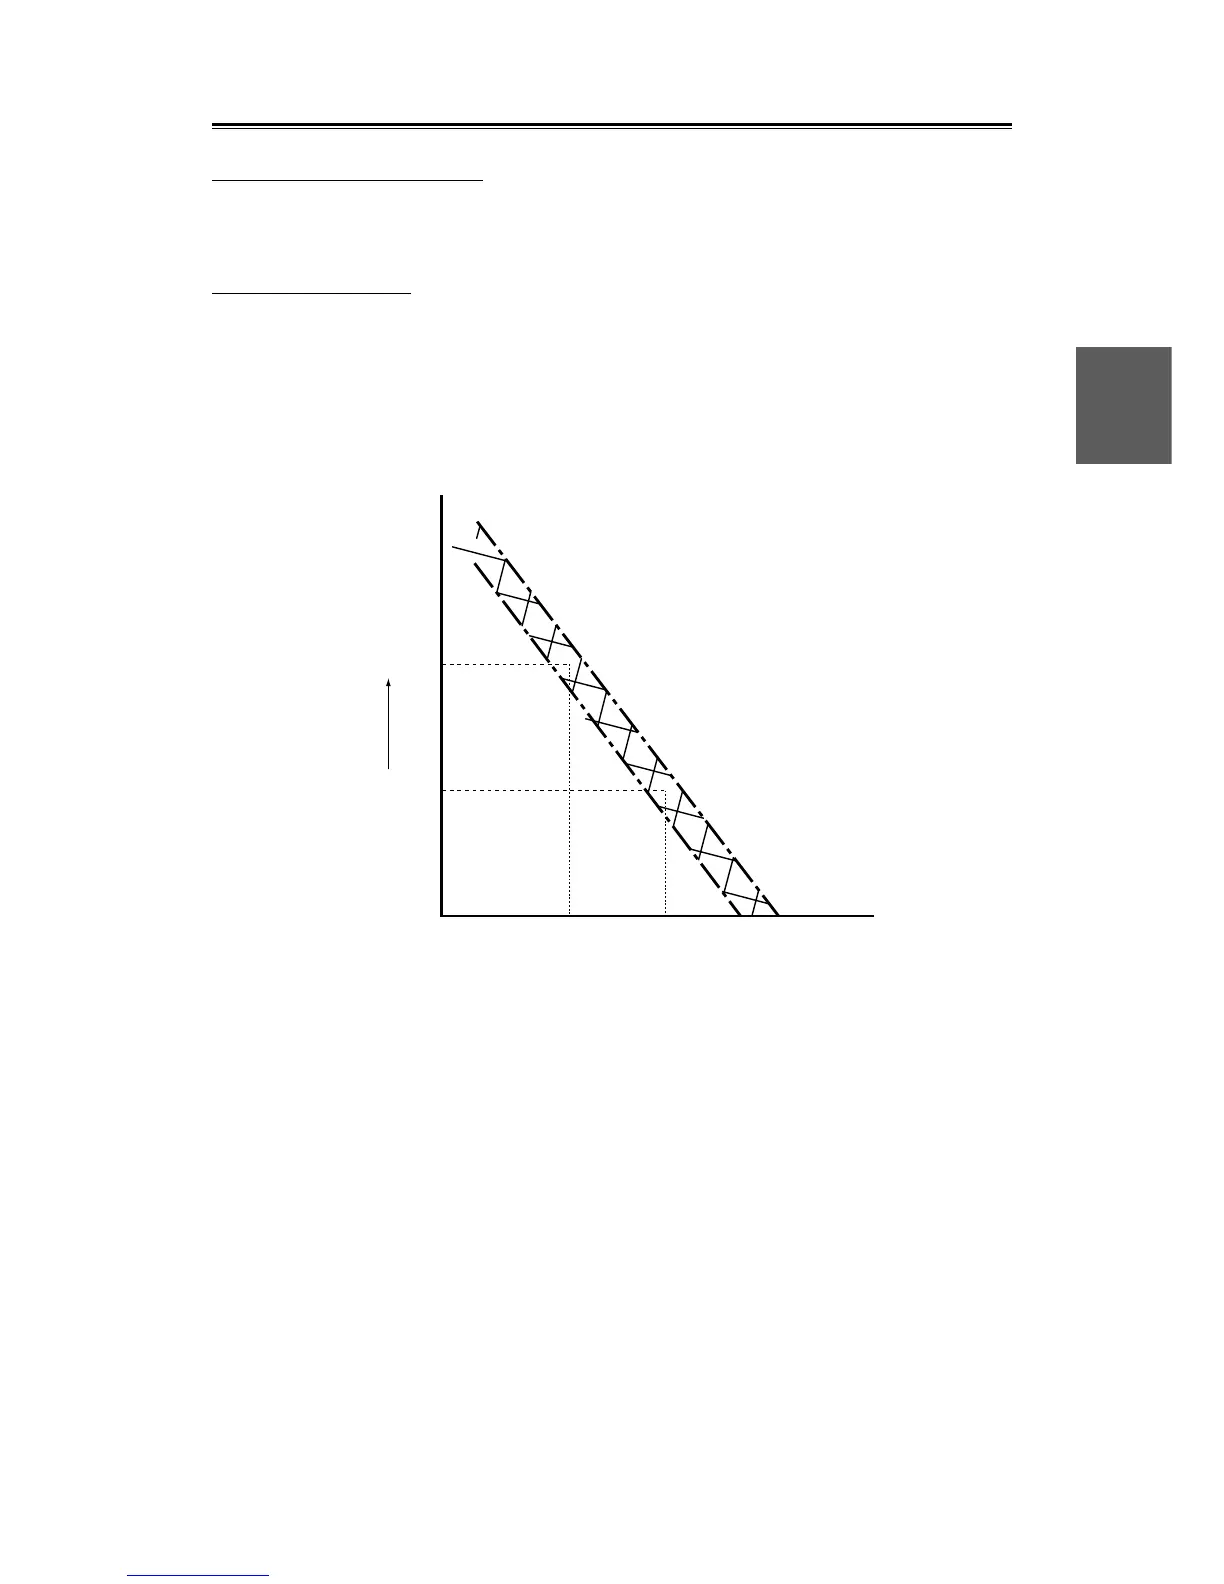
The maximum range of the PM pattern displayed on the screen represents the decrease in sensitivity of the
receiving system.
Checking procedures:
q With regard to the PM pattern displayed on the screen, the maximum range rmax from the PPI center
using VRM.
w Using calibration curve II, decrease in sensitivity corresponding to rmax, R (rmax), then the value of
R (rmax) represents the current decrease in sensitivity of the receiving system.
Calibration Curve II
Maximum range of PM pattern, r max
16
14
12
10
8
6
4
2
0
dB
Sensitivity reduction, R (max)
120 13 14 15 16 17 18 (NM)
 Loading...