6-6
6.3 Sea Clutter And Rain And Snow Clutter
y
yy
yyy
6
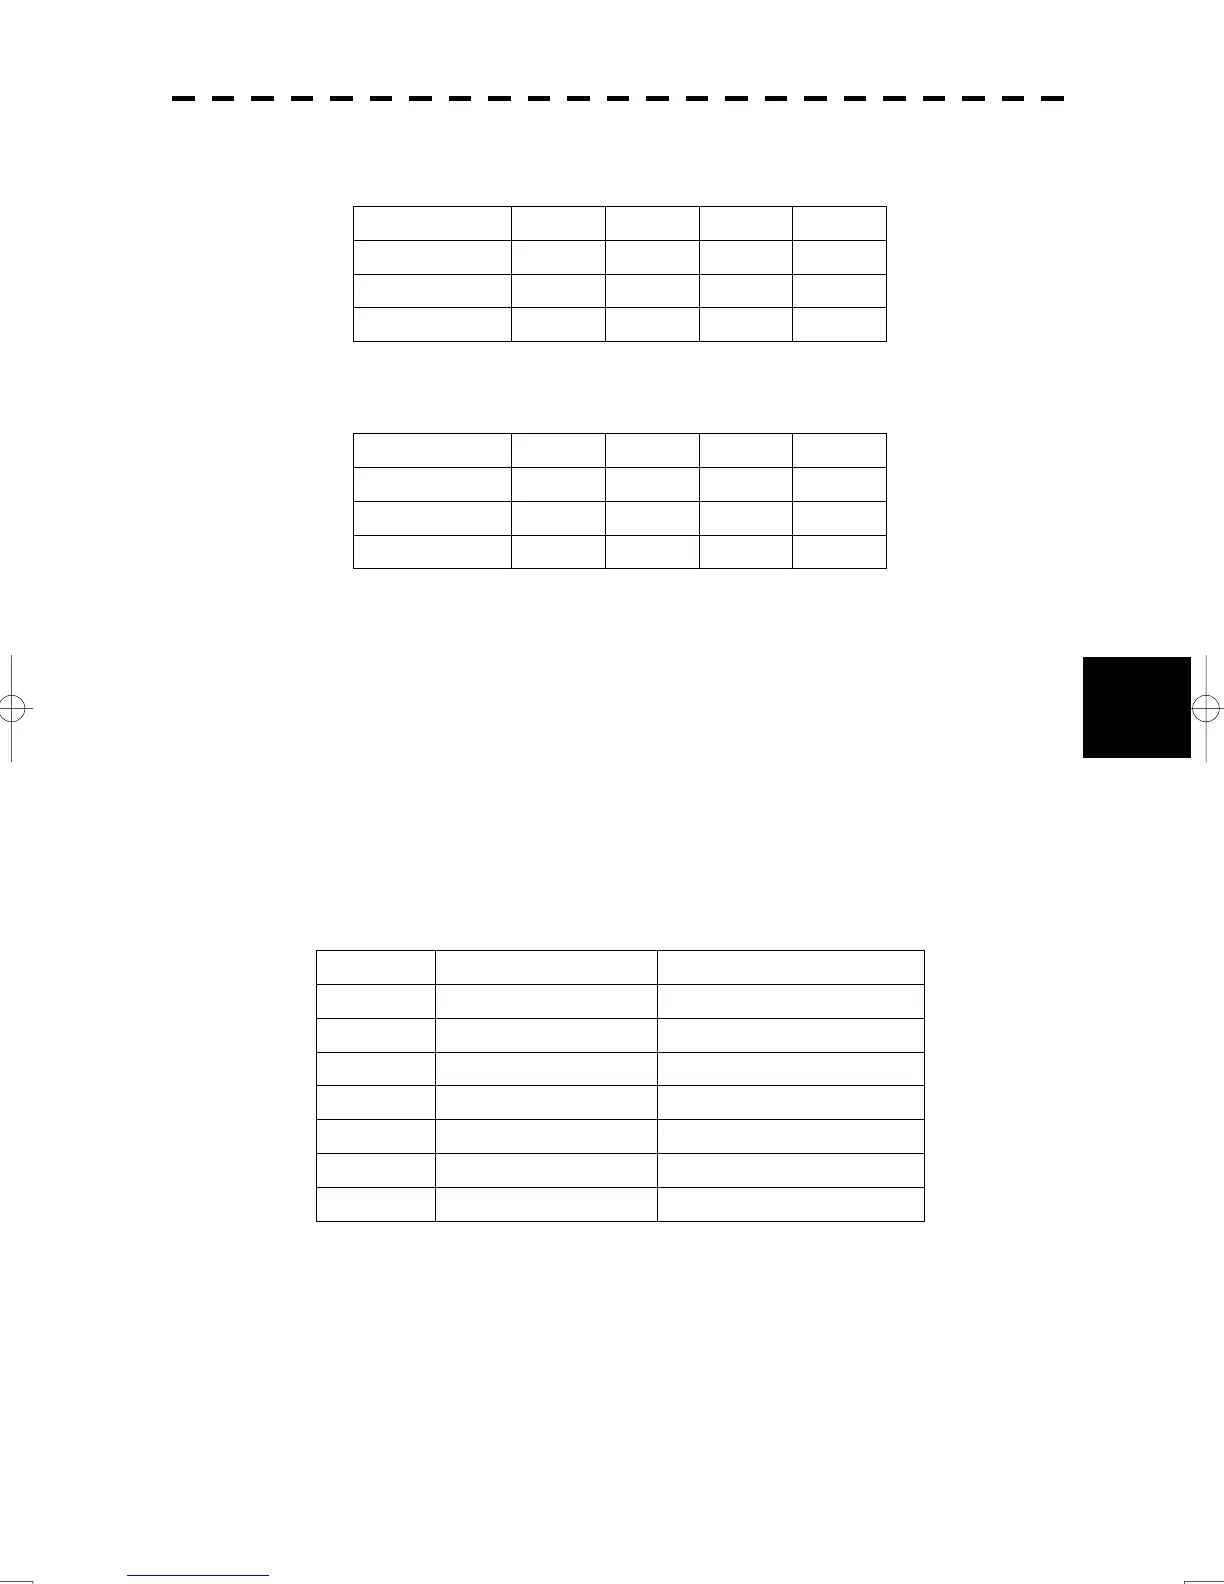
Table 6.2 Sea state and probability of target detection
S band radar (probability to detect a target at a distance of 0.4 NM)
X band radar (probability to detect a target at a distance of 0.7 NM)
V: Detection probability of 80 %
M: Detection probability of 50 %
NV: Detection probability of less than 50 %
As shown in Table 6.3, the number of SS increases as the wind speed becomes high and the waves become
large. Table 6.2 reveals that detection probability decreases from V (80 %) to NV (less than 50 %) as the
number of SS increases. Therefore, even if the sea state is calm and a target clearly appears on the radar
display, when the sea state becomes rough, target detection probability decreases resulting in difficulty of
target detection by the radar.
Table 6.3 Relation between Douglas sea state and average wind speed and significant wave height
Significant wave height: an average of top N/3 higher waves when the number
of waves detected within a constant time duration is N
For example, in the case of a standard marine buoy, RCS of X band radar is 5 m2 as shown in Table 6.1.
When observing such a target in the sea state (SS3) in which significant wave height exceeds 1.2 meters,
detection probability is M-NV, as shown in Table 6.2, which indicates 50 % or less.
RCS SS1 to 2 SS2 to 3 SS3 to 4 SS4 to 5
0.1m
2
V V-M M-NV
0.5 m
2
V V V-M M-NV
1 m
2
V V V V-M
RCS SS1 to 2 SS2 to 3 SS3 to 4 SS4 to 5
1m
2
V-M M-NV
5 m
2
V V-M M-NV
10 m
2
V V V V-M
Sea state Average wind speed (kn) Significant wave height (m)
0 <4 <0.2
1 5-7 0.6
2 7-11 0.9
3 12-16 1.2
4 17-19 2.0
5 20-25 3.0
6 26-33 4.0
 Loading...