Chapter 11: Sensor Verification
ValProbe RT User Manual 114
temperature reference is not found, the system does not allow automated Verification. In this
case, only a manual verification is possible. If neither are found, the Verification process cannot
be run.
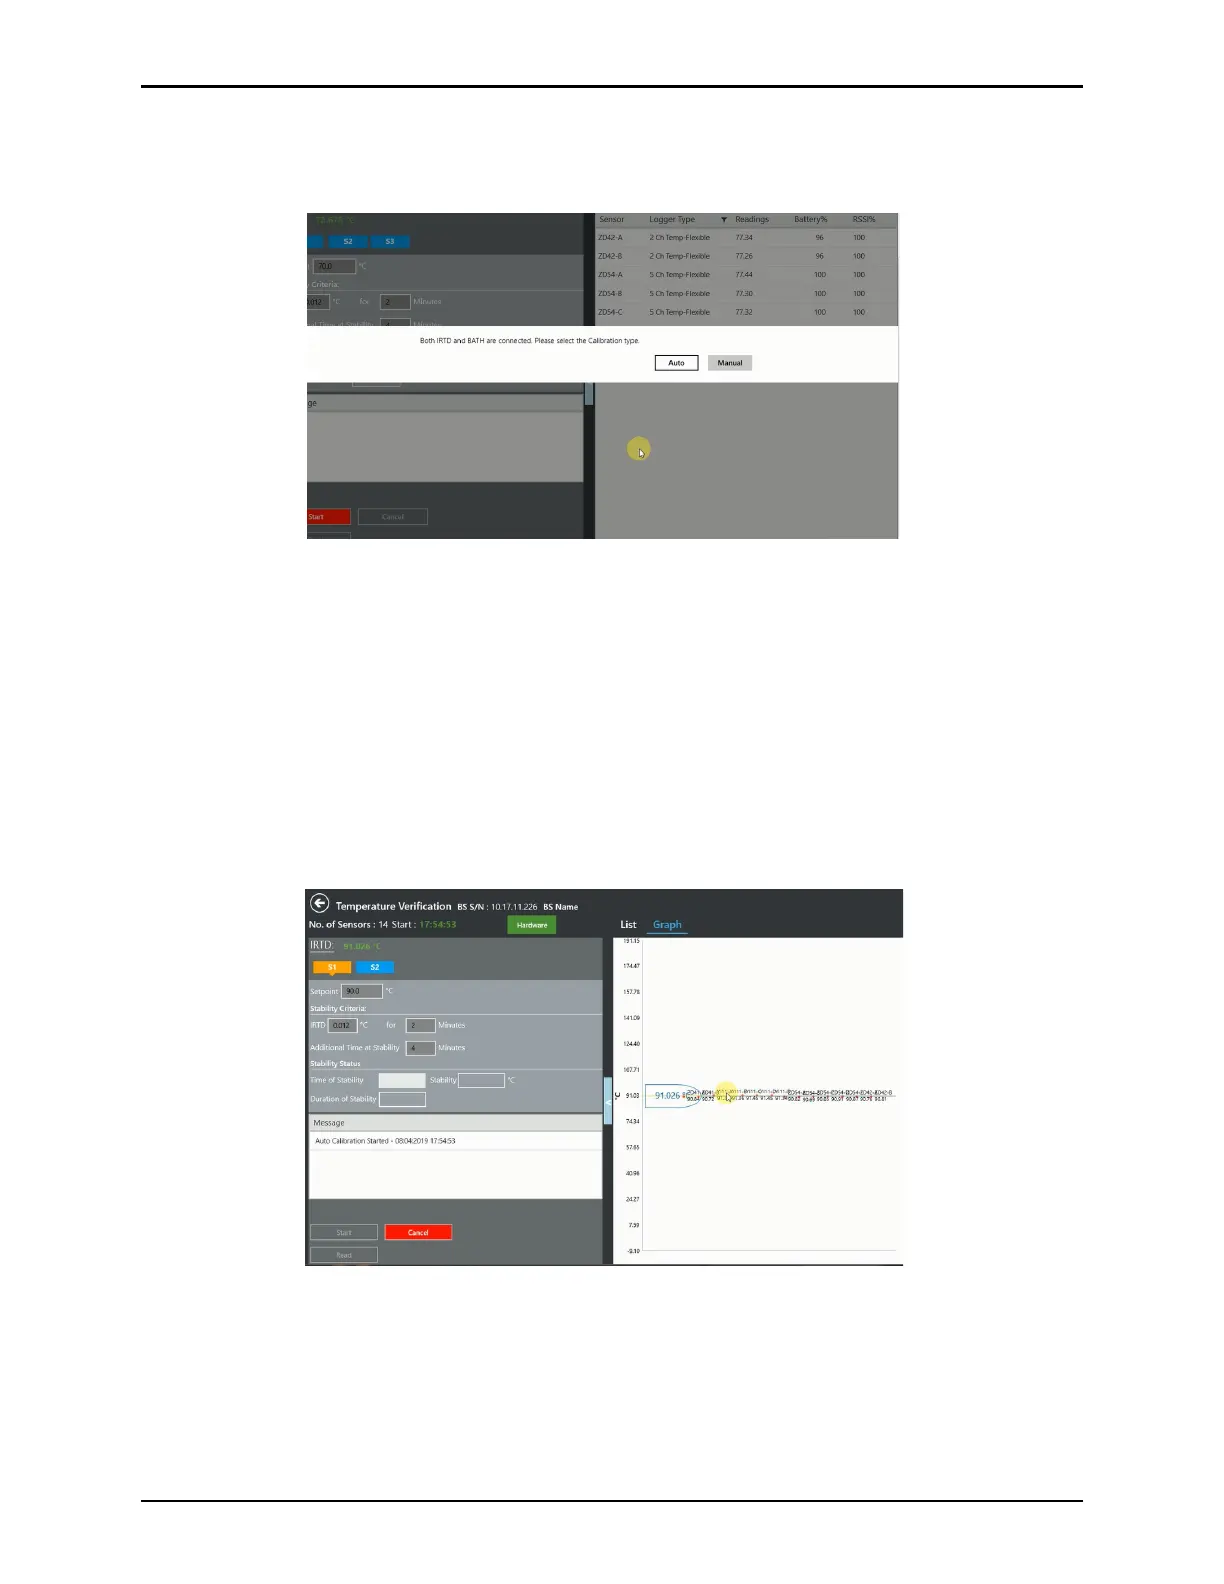
Figure 151: Auto / Manual Verification Prompt
If Auto calibration is selected the Base Station sends the corresponding setpoint to the
Reference
During the verification process, live data is displayable in two ways, in a Graph view and List
view. If the list exceeds the screen size, use the scroll bar to see the remaining data. On the
graph, temperature/humidity appears on the Y-axis, while the highlighted X-axis displays the
stabilized IRTD temperature, or the stabilized RH for humidity. All sample points that lie within
the deviation specified are displayed as dots along with the label and the temperature point of
the sensor. Samples that deviate from specification are displayed as red dots along with a
sensor label, temperature/humidity point, and a value indicating how much the sensor is off.
Figure 152: Temperature Verification Graph View
The first step in the Temperature Verification process is to verify that the IRTD is stable.
Stability is the maximum allowable change in temperature for the temperature standard over
the specified time interval. The maximum allowable change in temperature for the IRTD is
fixed at 0.012°C if all temperature setpoints are equal to or greater than 0°C. If any
temperature setpoint is less than 0°C, it is possible to change the IRTD stability value
manually in your setup.