Chapter 5 Viewing measurement results
Page 5-16 MAN 0474
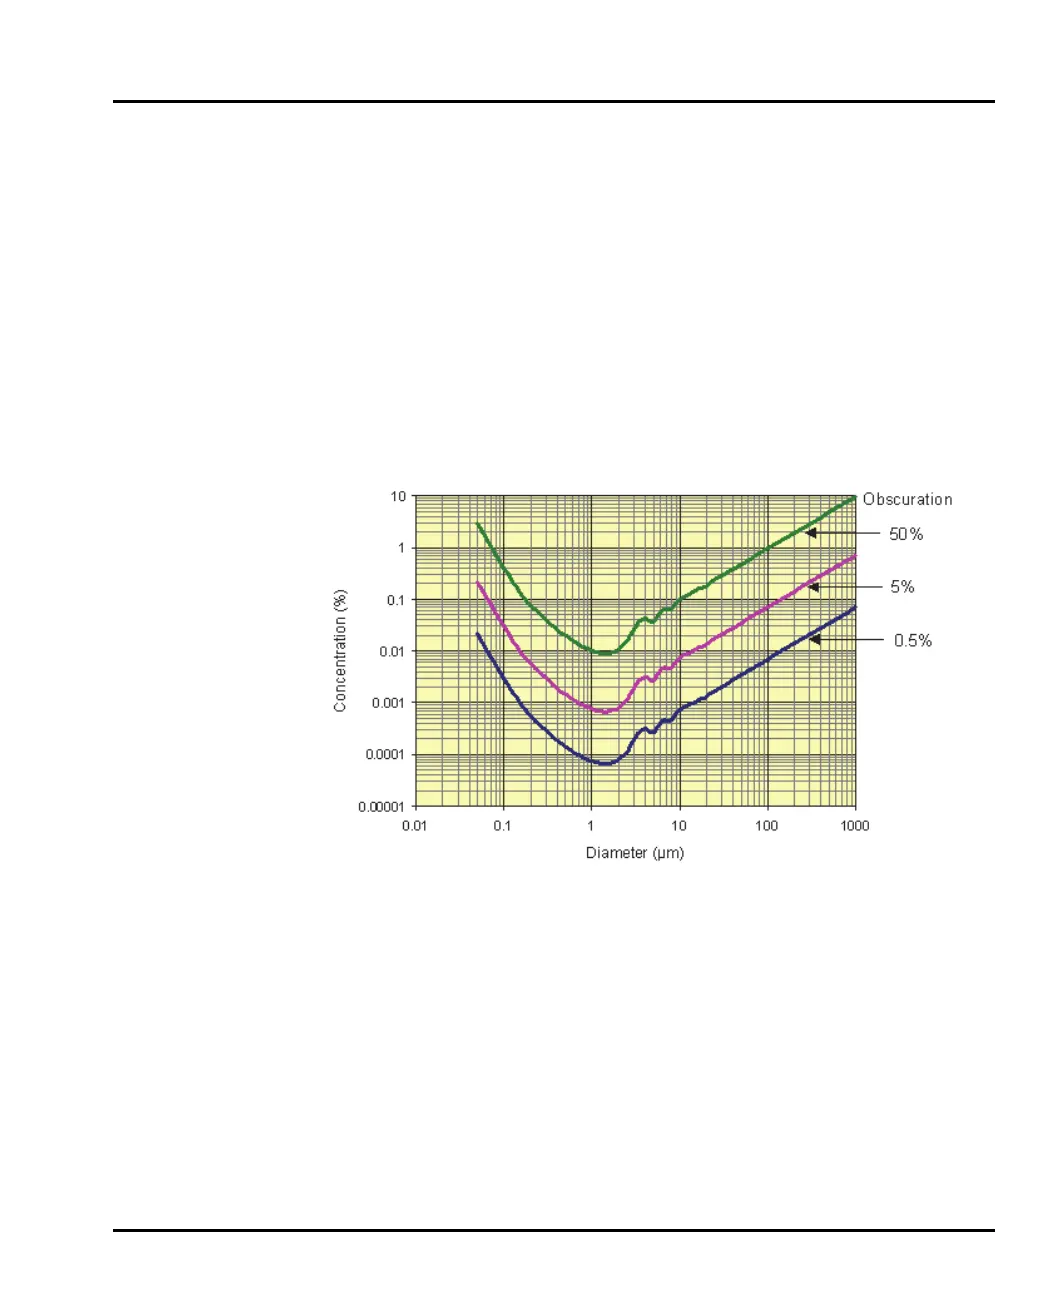
Concentration at different obscurations
This advice gives an approximate idea of the obscuration ranges to use during a
measurement.
It is possible to convert the obscuration limits into an equivalent volume concen-
tration but there is a strong size dependence that makes it difficult to use the data at
the time of measurement. The relative volume concentrations of monomodal (sin-
gle sized) particles that would give a certain obscuration is illustrated below. The
actual curves differ according to the presentation being used. It will be clear that
there is a size dependence; an obscuration of 30% means a widely varying volume
concentration dependent on size.
Concentration at different obscurations
Calculated for glass beads in water (n=1.54 +i0) in water
In the more realistic situation of a polydisperse (or multimodal) sample it is not
possible to provide simple graphical correlations of volume concentrations and
obscuration. The system calculates concentration, however, using the size distribu-
tion result and the obscuration.
For a polydisperse sample the curve of the above figure can be used if the
Surface Weighted Mean (D[3, 2]) of the material is taken as single size.
Volume-based results
The first, and probably most important, point to remember in interpreting results
is that the fundamental size distribution derived by this technique is volume-based.
This means that when a result indicates, for example, that 11% of the distribution is