Making measurements Chapter 4
Mastersizer 3000 Page 4-11
Main figure – the actual size measurement (μm) for the single base record
that is currently selected (Dv10 - blue, Dv50 - green, Dv90 - red).
Av – the average particle size (μm) for the selected range.
RSD – Relative Standard Deviation (%) for the selected range.
Min – the minimum particle size (μm) for the selected range.
Max – the maximum particle size (μm) for the selected range.
To modify which figures are shown in the Trend view:
1. Right-click anywhere on the trend graph and choose Statistics.
2. Select or de-select the items required.
Tip
Click anywhere on the graph line to display data points - click again on the
line to remove them. Move the mouse pointer over a data point to display
its record number and size figure, for example 4, 891.09 indicates that
Record 4 has a measured size of 891.09μm.
Selecting a range of records in the trend view
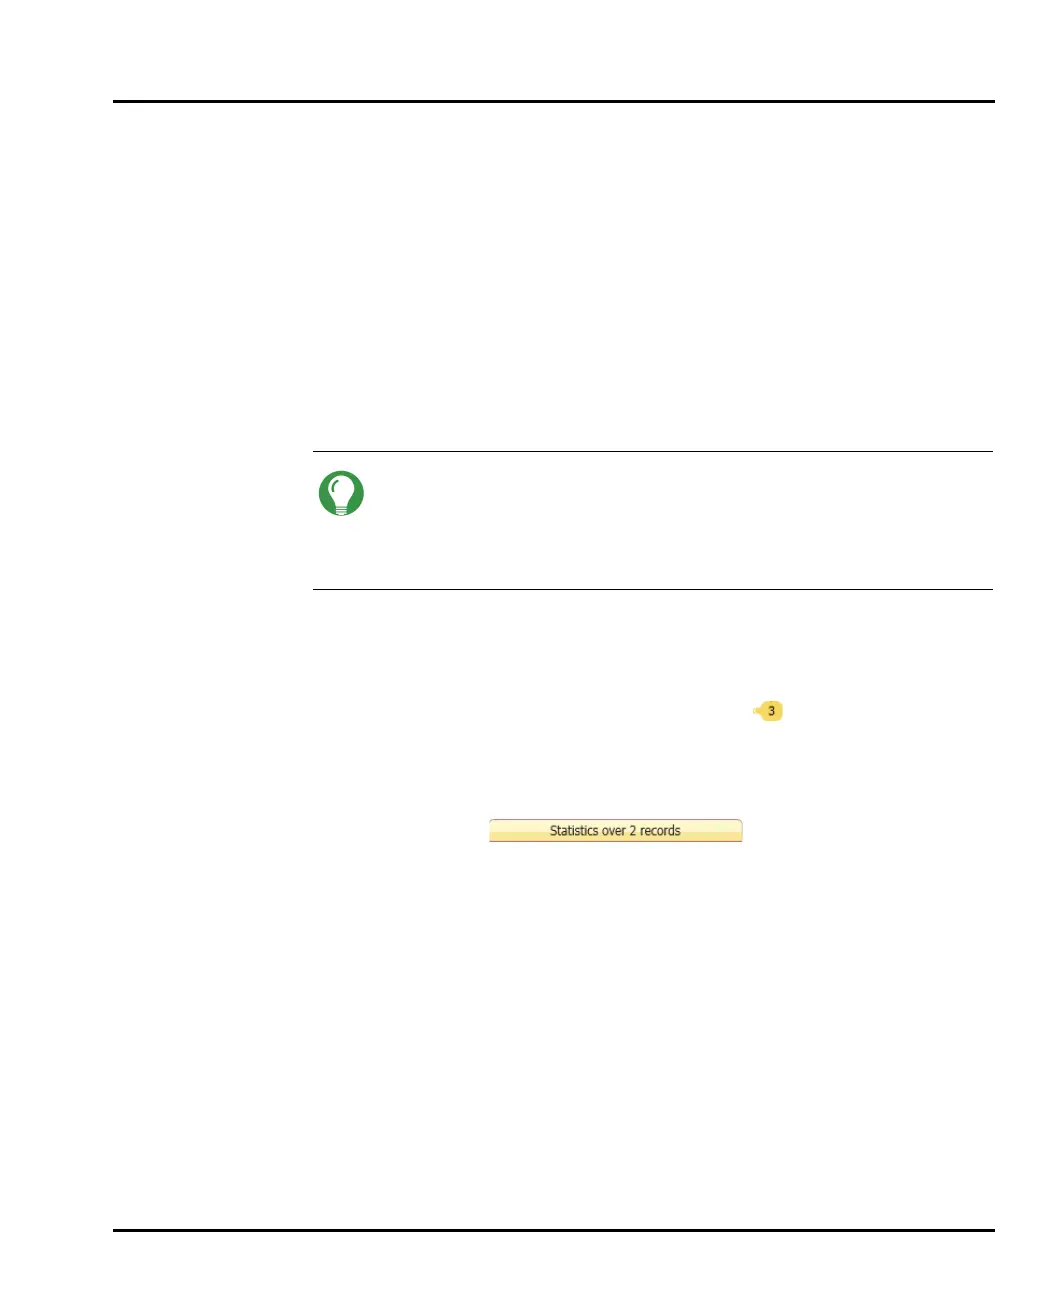
After running several measurements, just one record is selected. Initially this is the
last measurement made. This record is shown by a vertical hairline bar with the
record number indicated at the bottom - for example, . The vertical hairline bar
always shows the currently selected record.
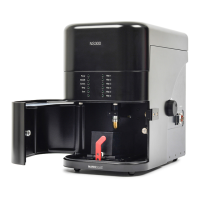
To expand the range to incorporate more records, click the left or right
selection arrow buttons at the top of this bar. The bar expands to cover the
records selected:
Click and drag this header bar to the left or right to reposition the selection
within the range of records. Alternatively, right-click the trend graph and
choose: Statistics range and then select the number of records.
To contract the range, click and drag the left hairline bar that denotes the
initial record in the selected range. Alternatively, right-click on the trend graph
and choose: Statistics range and then select the number of records to include
in the selected range. If you have manually dragged the bar to cover a number
of records not listed in the Statistics range menu, Custom and the number
of records currently selected is displayed.
All numerical data then provided is the arithmetic mean of the currently selected
records, with the exception of the initial particle size figure, which is still the figure
for the single record.