Chapter 7 Reporting
Page 7-6 MAN 0474
2. Click MANUAL and then enter the required lower and upper limits (click
anywhere outside the input box to confirm the figure).
3. To return the graph to the automatically-adjusted setting, click AUTO.
Tip
This feature is also available in the live Trend View, Light Scattering
and Size Distribution panels in the measurement window.
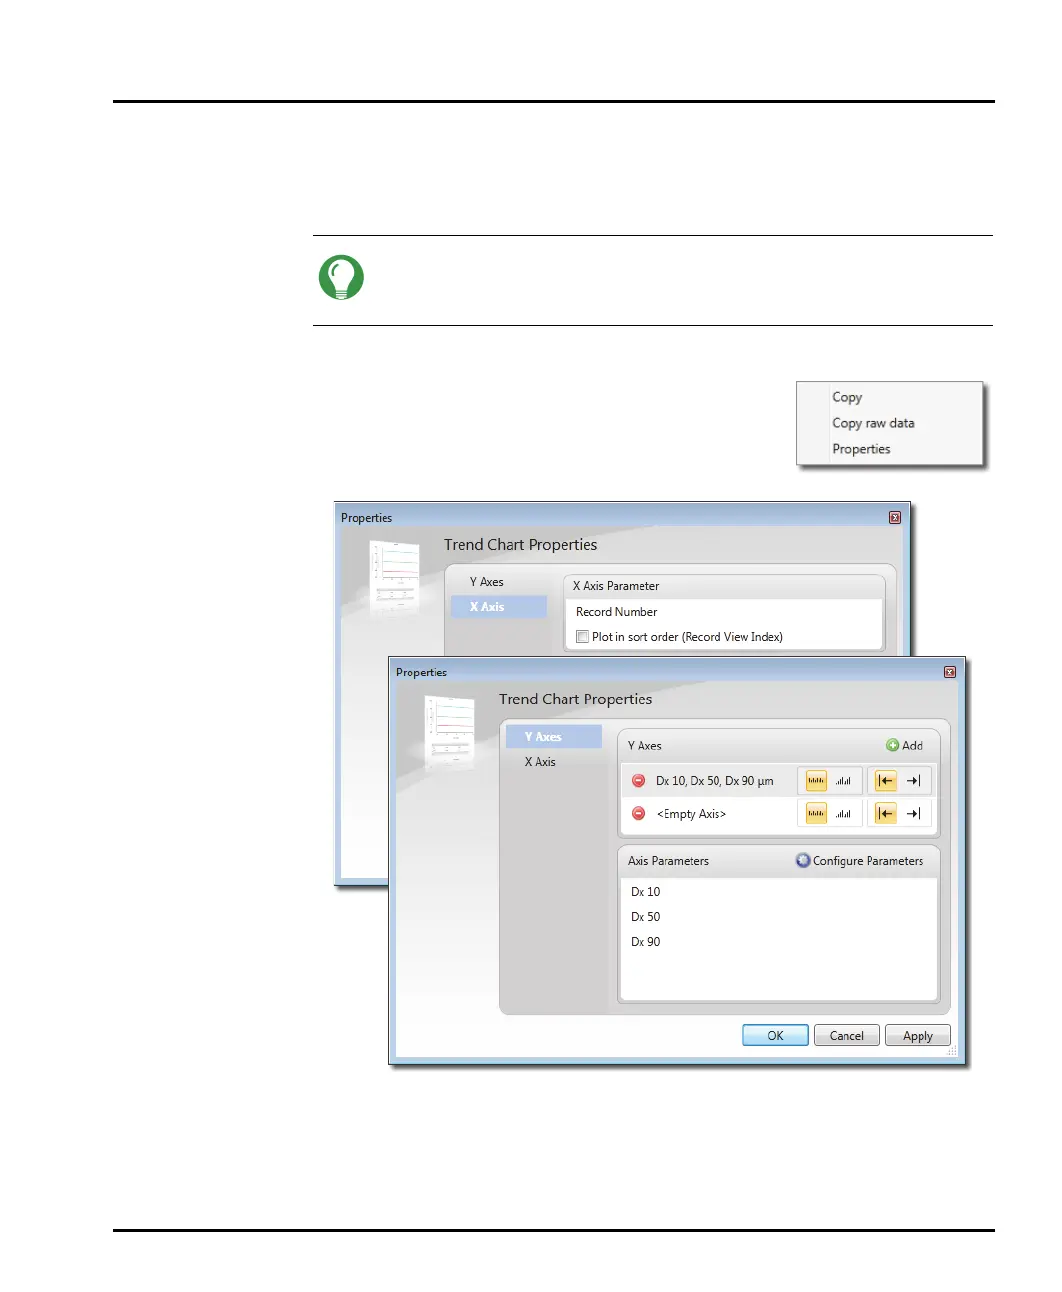
To alter the information shown on the graph:
1. Right click on the graph and select properties from
the pop up.
2. This will open the Trend Chart properties win-
dow.
3. Select either the X or Y Axis button on the left. The data currently plotted is
shown in the top panel of the window.