Reporting Chapter 7
Mastersizer 3000 Page 7-5
4. Move reports from the Available Reports column to the Selected Reports
column by selecting them and then clicking the Add
button. Similarly,
move Selected Reports back to the Available Reports list by selecting them
and then clicking the Remove
button.
5. To move a report up or down within the Selected list, select it and then click
the up or down arrow icons
as required. The order of this list corre-
sponds to the left/right position of the Reports tabs, the leftmost tab being the
top report in the Selected Reports list.
6. Click OK when you have organised the reports as required.
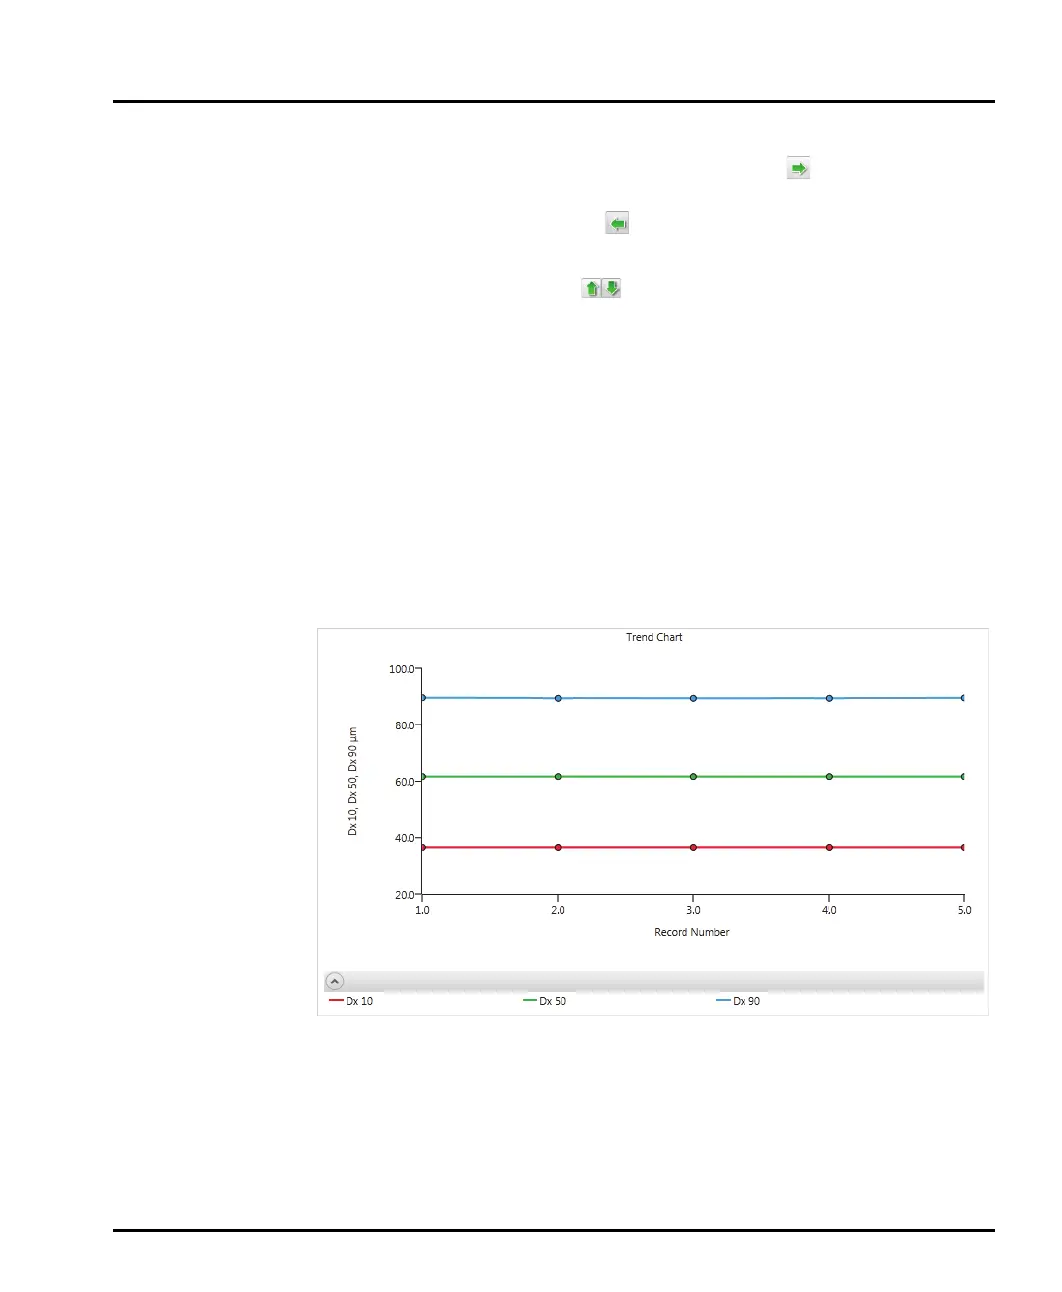
Trend Graphs (in reports)
Similar to the trend plot shown in Manual Measurements, the reporting trend
chart shows a graphical plot for each record from a measurement that is currently
selected in the Record View.
By default trend graphs plot Dv10, Dv50, Dv90 data against record number. Each
parameter is given a different colour. Click on the graph line to reveal data points -
move the mouse pointer over those points to reveal numeric values.
Editing a Trend Graph
To alter the axis scaling limits:
1. Move the mouse pointer over the X or Y axis to display the scale adjustment
feature.