Reporting Chapter 7
Mastersizer 3000 Page 7-3
Viewing and using reports
This section describes how to view and manipulate reports about the records con-
tained within measurement files. It is assumed that a measurement file is open and
that it contains several records.
Displaying reports
1. Select a record or number of records from the Record View.
2. If it is not already shown in the current view, select the Reports tab. One of
the reports for the current workspace is then shown (by default this is the Anal
-
ysis report).
It can be easier to work in 2-pane Vertical Split view whilst initially selecting
the records. Any selections or de-selections of records are then updated imme-
diately in the visible report.
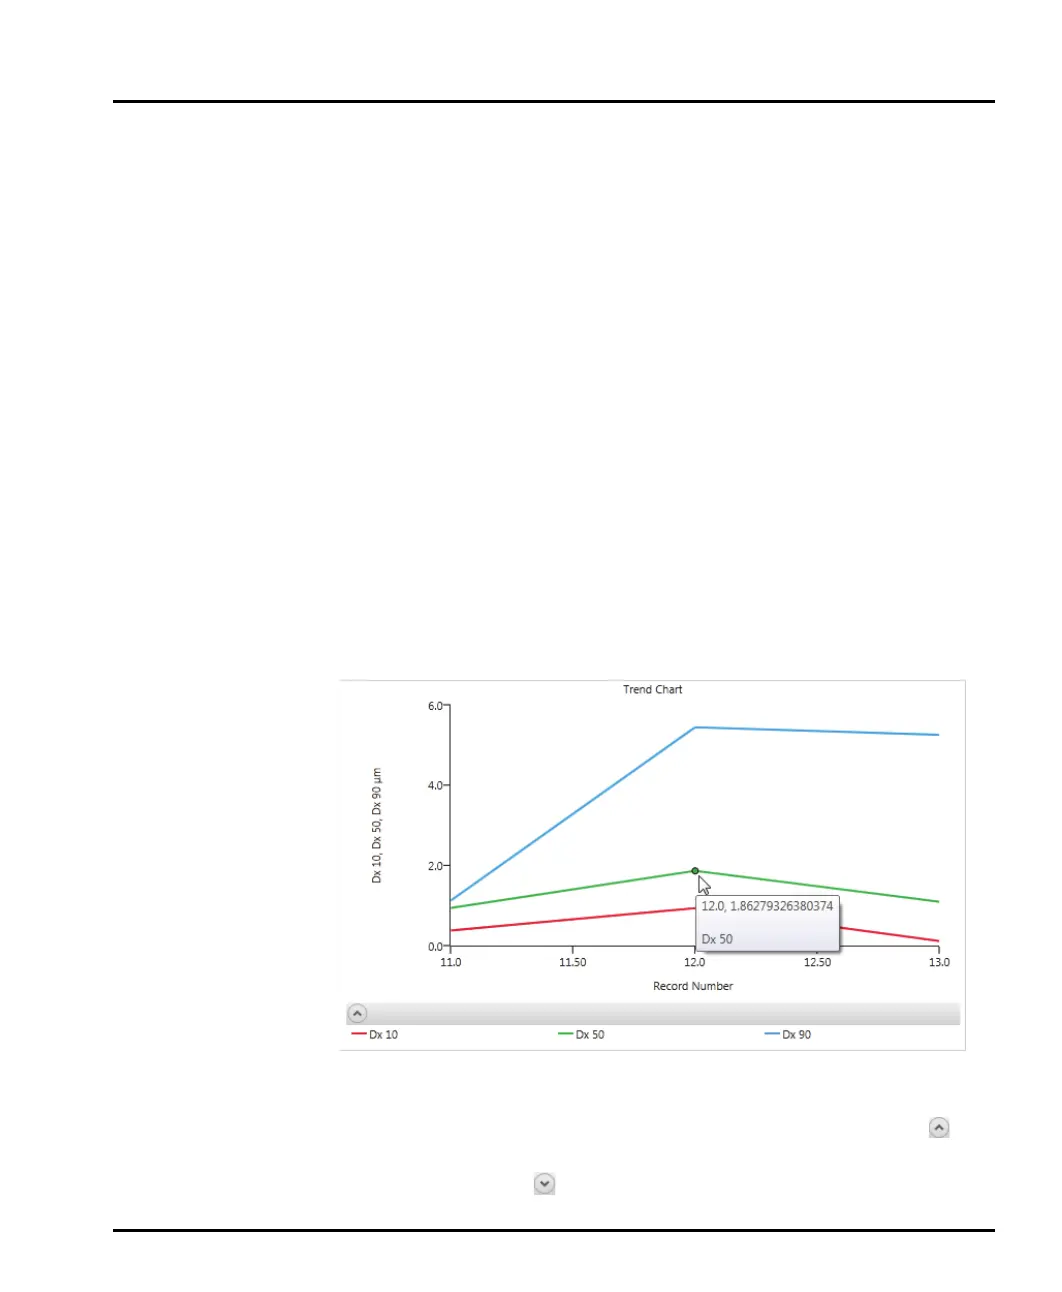
Graphs
Three types of graph are used within the reports: result, trend and data graphs.
Whenever a graph is displayed, click on the plot lines to display data points. Move
the mouse pointer over the data lines to see numerical information relating to that
data point.
Collapsing/expanding report sections
To collapse the individual sections within a report, click the up arrow icon to
the left of the report section title. To expand an already collapsed report section,
click the down arrow icon
to the left of the report section title.