Chapter 4 Making measurements
Page 4-12 MAN 0474
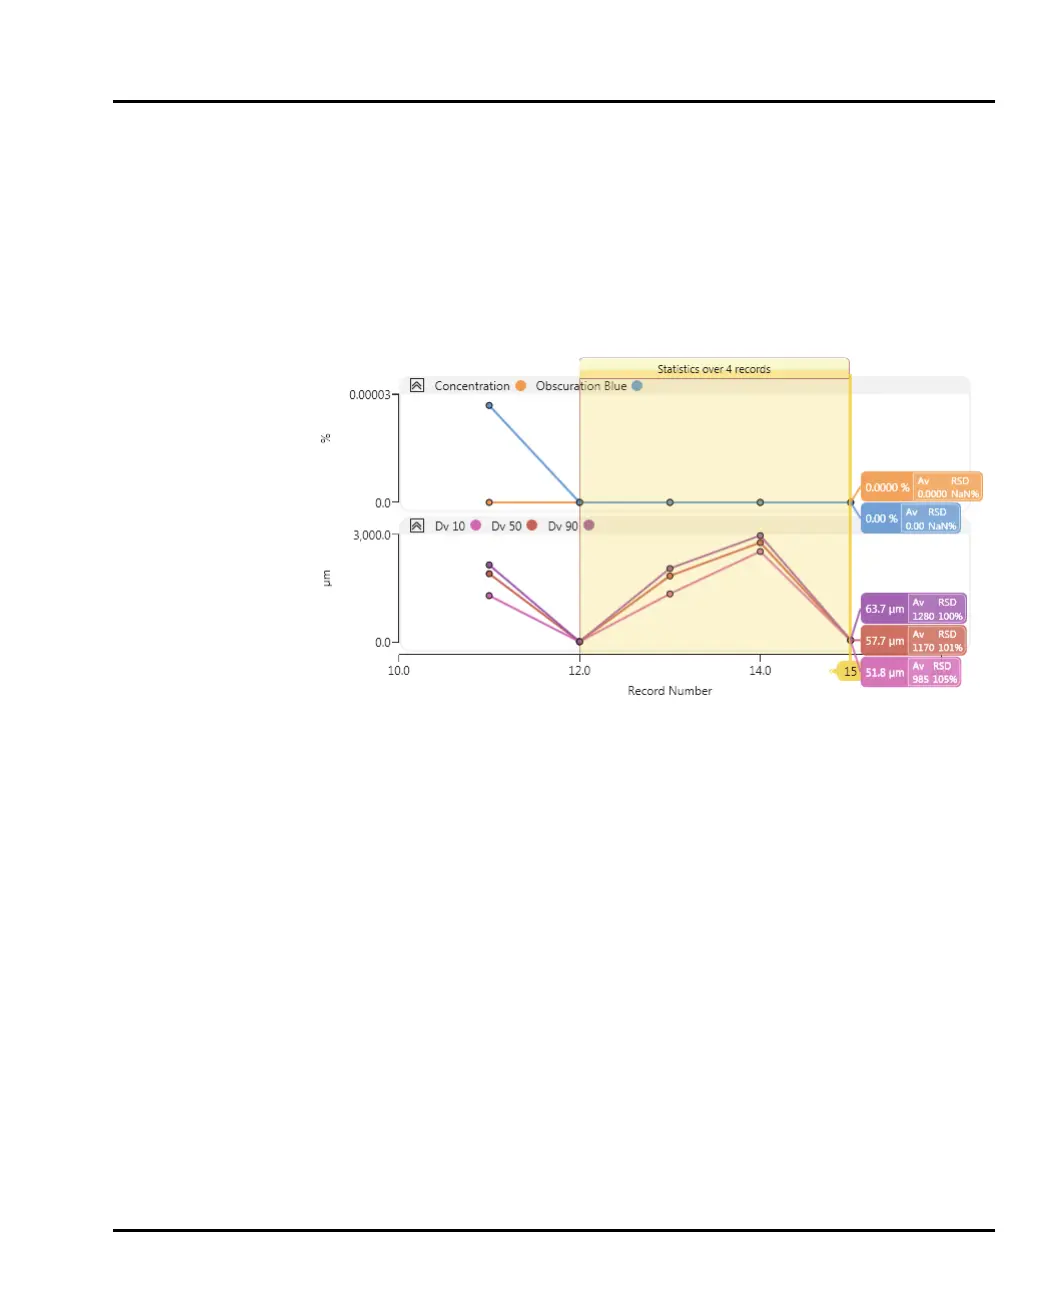
Adding further trend graphs
Add additional plots using the following method (note that the new plot needs to
be configured prior to making the measurement in order to display data):
1. Right-click on the trend graph and select Add above or Add below to add a
new plot.
2. Then choose parameters from the Parameter Selection window and click
OK.
To remove the new plot, right-click it and choose Delete.