Reporting Chapter 7
Mastersizer 3000 Page 7-7
4. To remove the currently plotted data, click next to the parameter descrip-
tion.
To add or select a new data item against which to plot, click the button.
A new <Empty Axis> element is added into the top panel.
5. Select the new <Empty Axis> element to display its properties in the lower
panel.
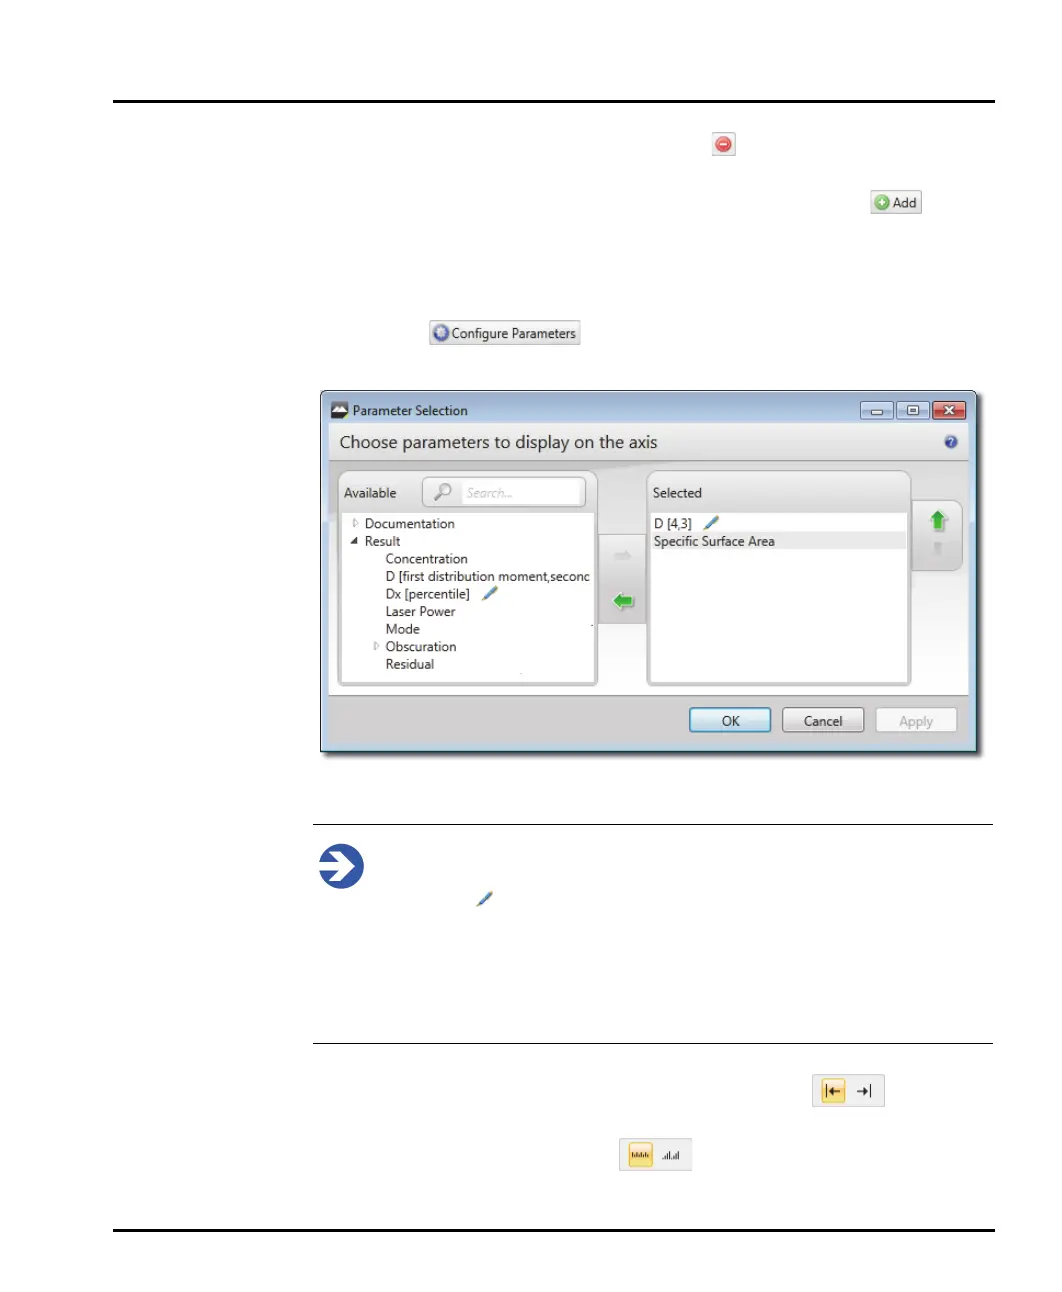
6. Click the button to add a parameter from the Parameter
Selection window.
7. Select the required parameters and press Ok to confirm selection.
Note
Parameters with numeric values (such as percentiles) are editable and indi-
cated with . To edit the parameter numeric value, click the parameter
and amend the value. Any value entered that is inappropriate for the
parameter is flagged with an exclamation mark icon - amend the value
accordingly if this is the case. It is possible to enter multiple variants of the
same parameter with different values associated (for example Dv10, Dv50
and Dv90). These are then indicated on the graph with different colours.
8. Select the Position in which the axis should be labelled - left or
right.
9. Finally, choose a Scale Type of - Linear or Logarithmic.