PTS 400.3 PLUS Operation Manual_R02 Page 196/306
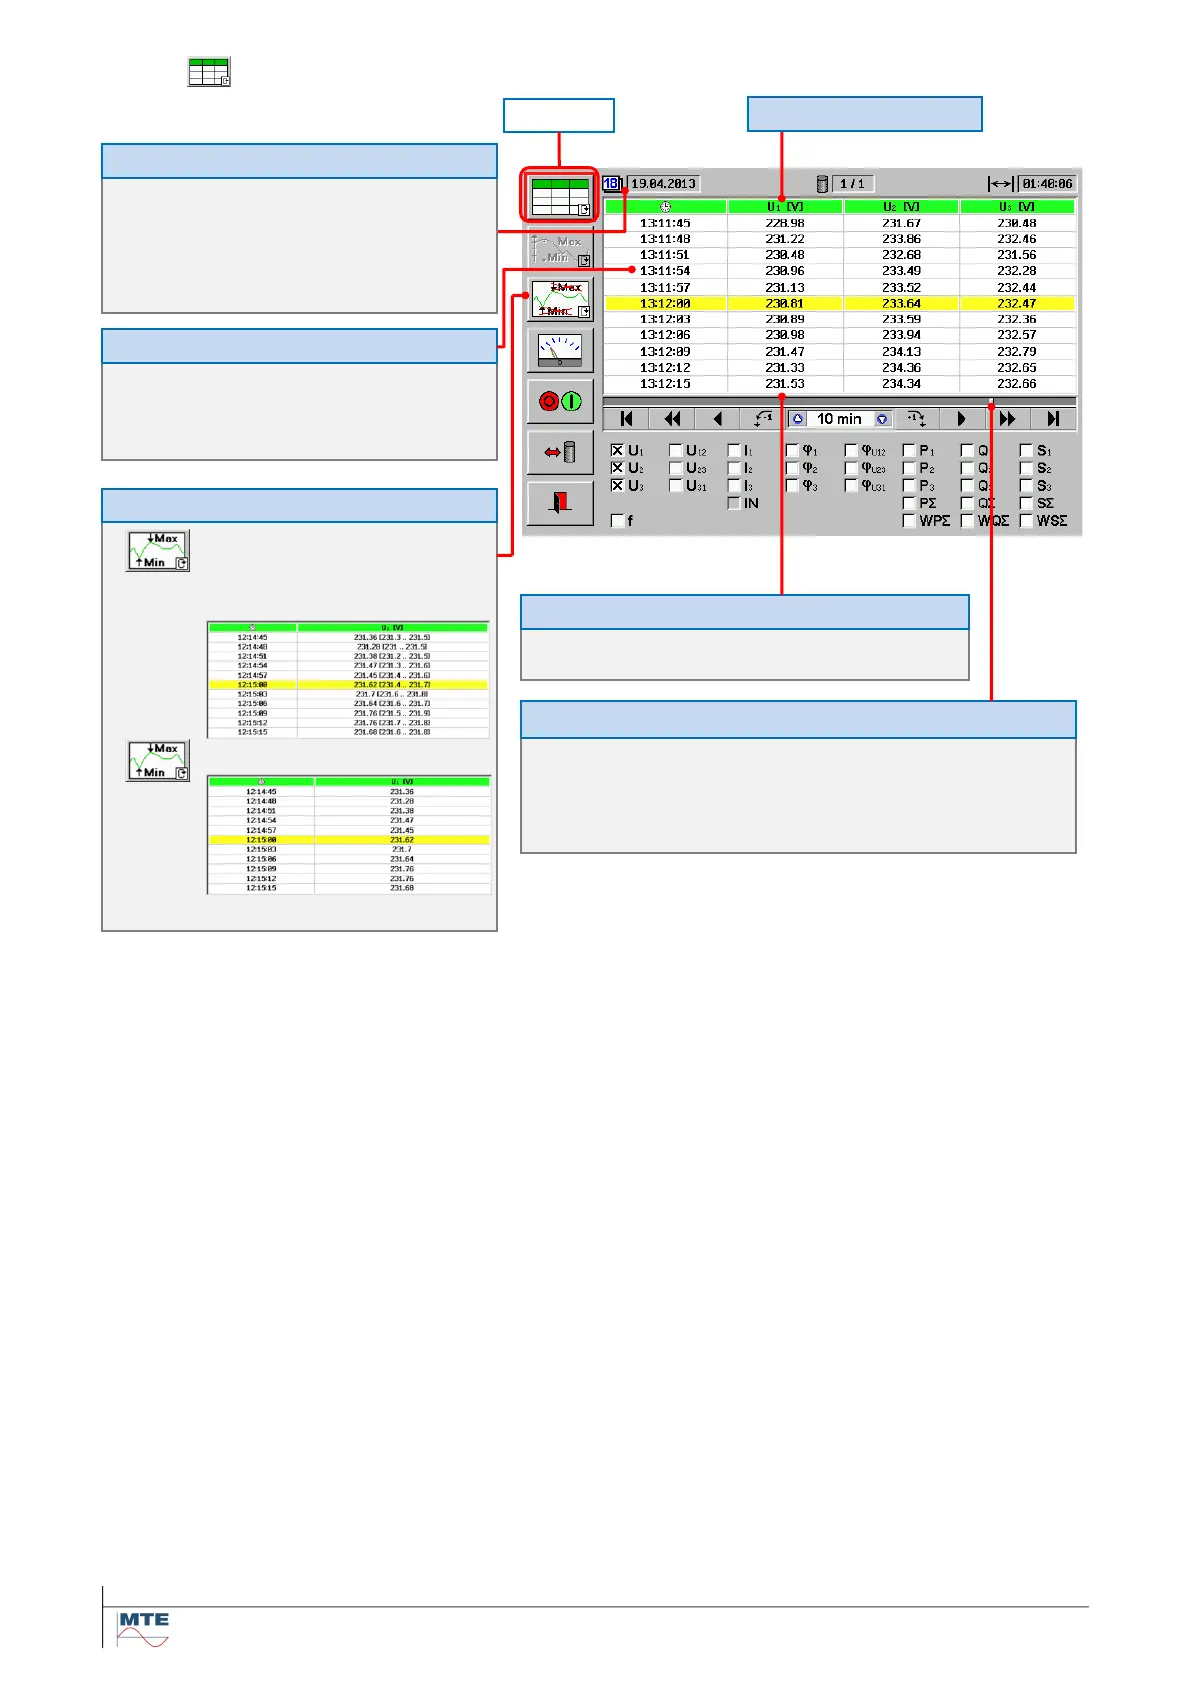
11.2.2 Table view
in format DD.MM.YYYY with
DD:
clock time marked with the
in format hh:mm:ss with:
hh:
Selected value with [unit]
Minimum Min and maximum Max val-
ues for each recording interval, evalu-
ated at intervals of 1/5 of the recording
interval, are shown in brackets.
Original values indicated only
The bar graph indicates the time span of the table section (30 s) and the po-
sition of the table section in relation to the total recording time (full bar graph
= 01:40:06).
Note: The time interval (10 min) indicated in the time control section has no
meaning for the table view.
A column contains 11 numerical consecutive results with
basic recording time interval (e.g. t = 3 s)
Position of table in total recording
 Loading...