PTS 400.3 PLUS Operation Manual_R02 Page 201/306
12.1.1
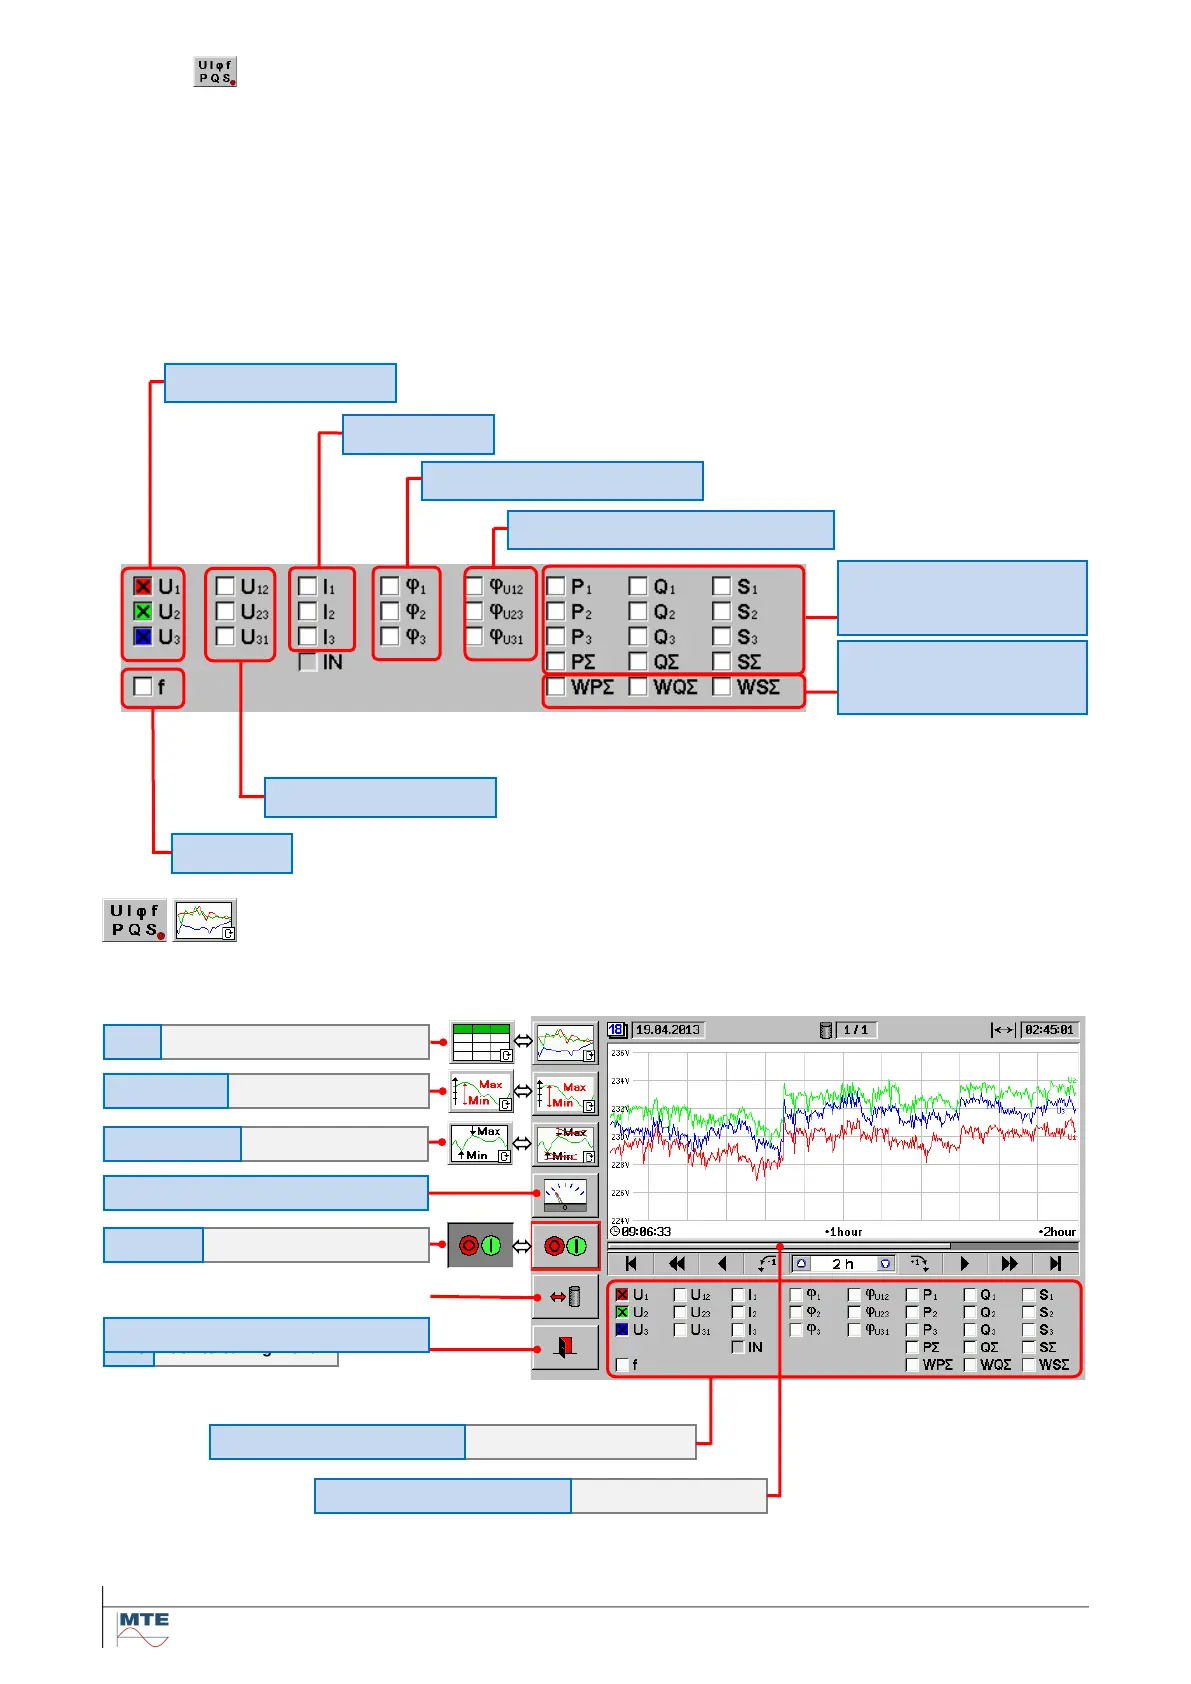
Magnitude UIfPQS
The root mean square (rms) values of voltage and current and the mean values for the other quanti-
ties are recorded in the configured aggregation intervals, exception power frequency (f), which is al-
ways recorded with interval 10s.
Additional to the standardized recording of the voltage values and power frequency also current,
phase angles, power and energy values can be recorded with high precision and simultaneously.
This allows further application of the instrument for precise load profiling or energy analysis.
The magnitude (rms or mean value) of the values listed with checkboxes can be analyzed individual
or in any combination from the single result up to a 24h overview of the recording.
Magnitude UIfPQS graph view
Example: PQ online analysis of phase to neutral voltages U1, U2, U3