PTS 400.3 PLUS Operation Manual_R02 Page 202/306
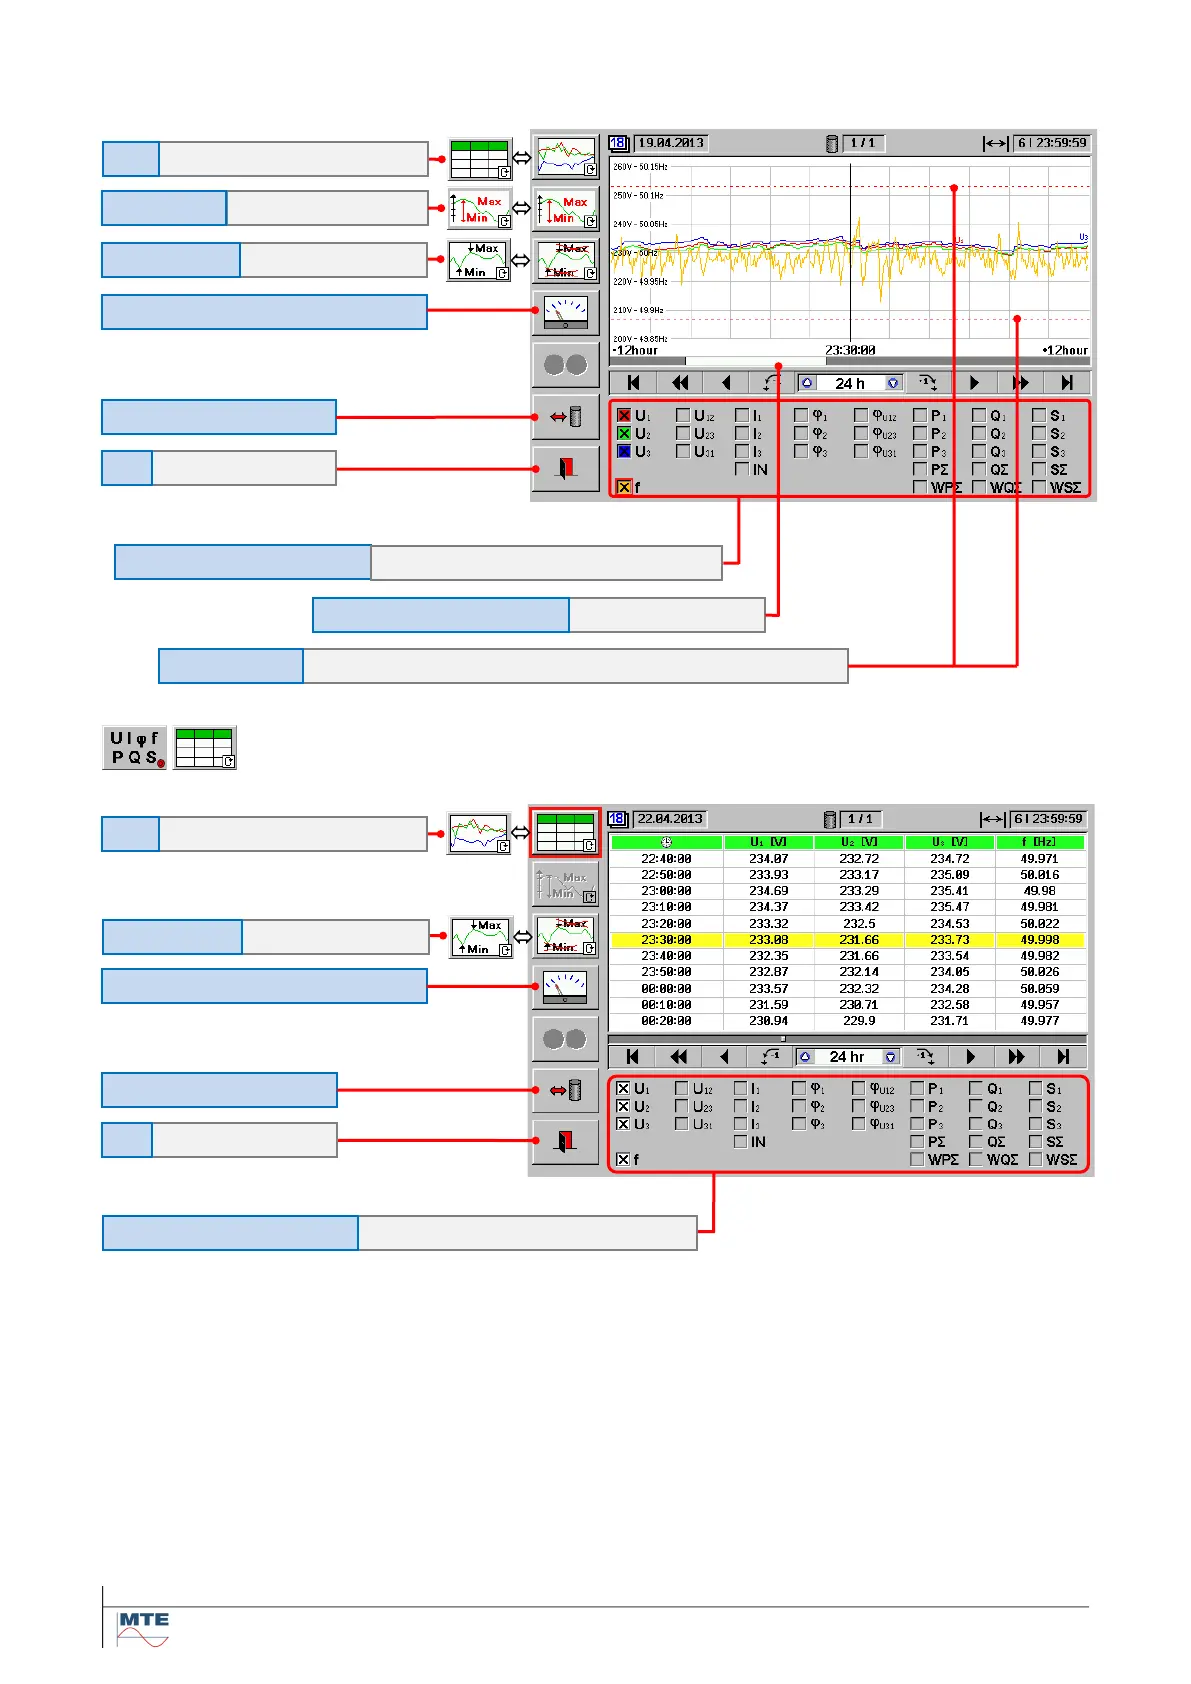
Example: Analysis of recorded phase to neutral voltages U1, U2, U3 and frequency of 1 week
Magnitude UIfPQS table view
Overview of actual load values [13.2]
Time interval of graph window
Selection of magnitude values
Phase voltages U1, U2, U3 and frequency f
Upper and lower limit for voltage (230V 10 %) regarding EN 50160
Phase voltages U1, U2, U3 and frequency
Overview of actual load values [13.2]
Selection of magnitude values


 To Next Page