ABL800 FLEX Operator's Manual 9. Data management
Quality Control Log, Continued
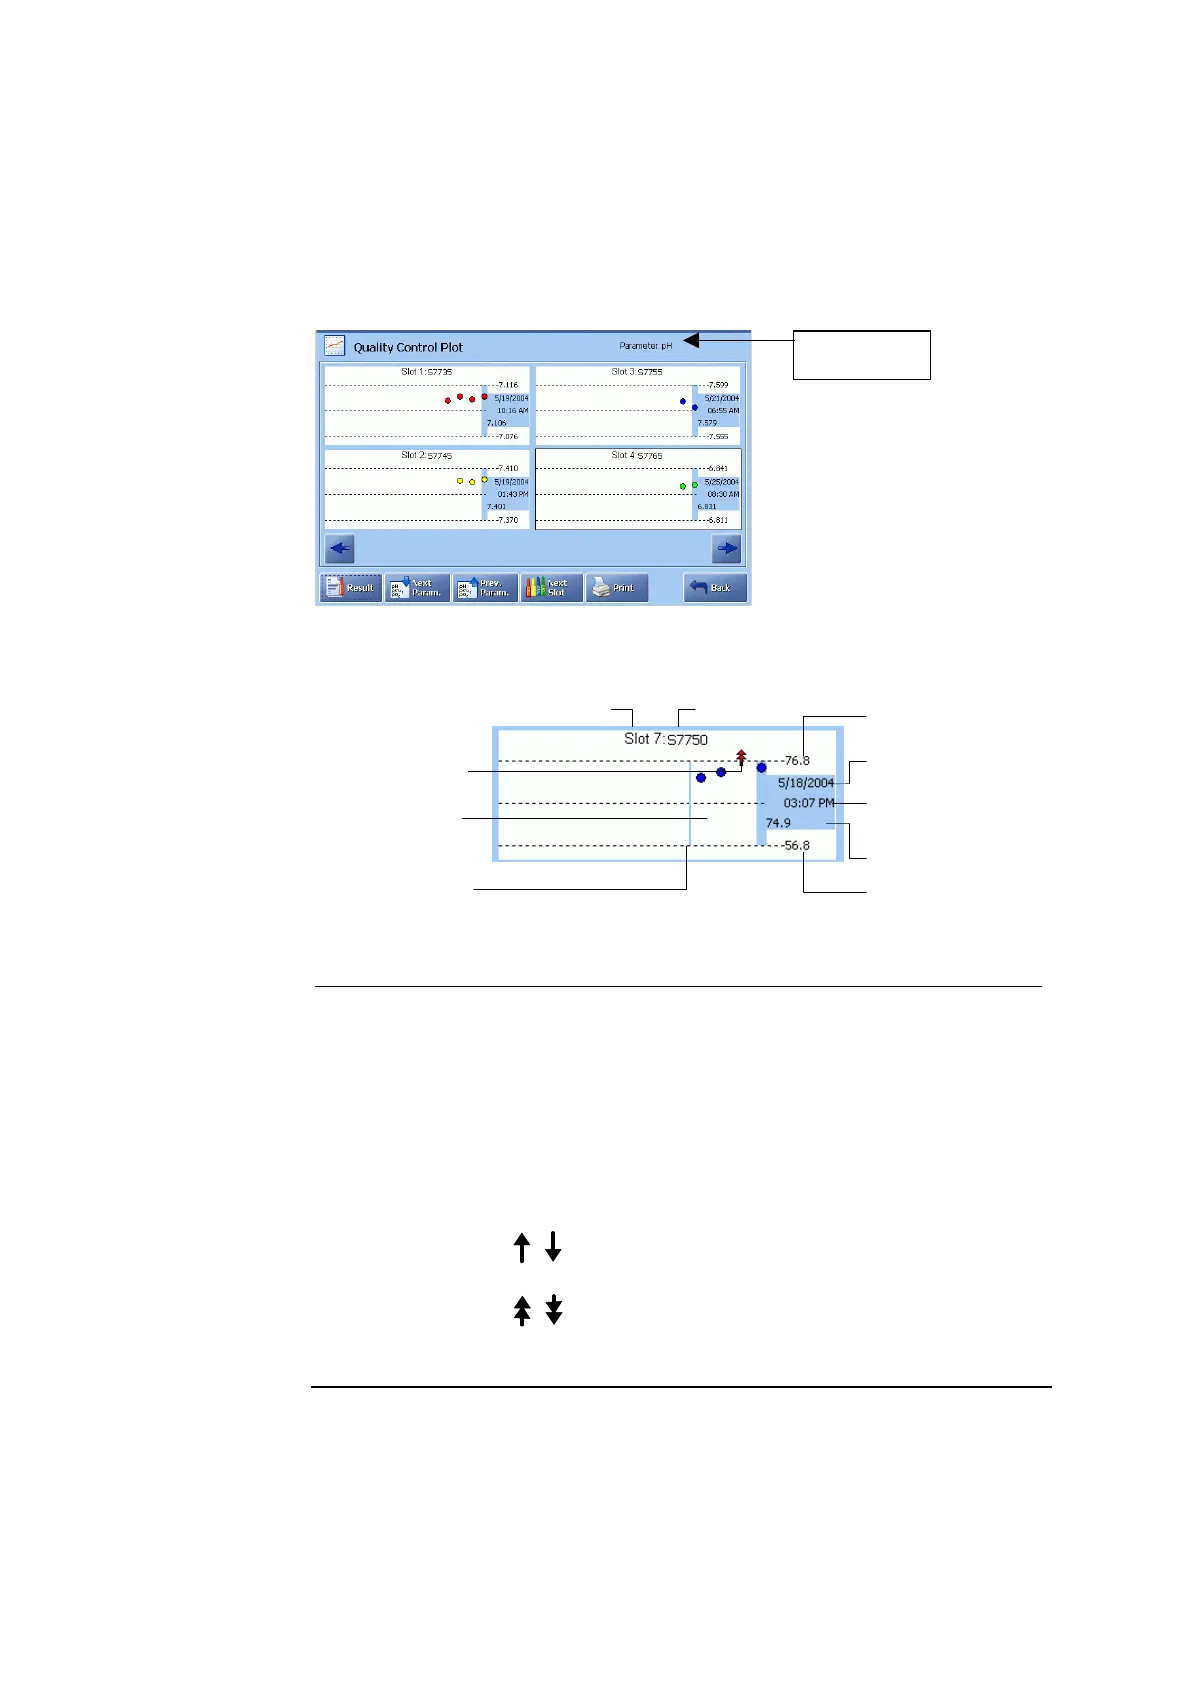
To view the Quality Control Plot screen press Plot on the Quality Control Log
screen.
Quality control
plot
The following diagram shows the details of a typical plot.
Time
Measurement
Slot numbe
Solution type
Out-of-range symbol
Control range upper limit
Control range lower limit
Measured value
Date
Lot change
Parameter
Plot element Function
Shaded block Date, time and measured value for the highlighted
measurement. Use the arrow buttons to scroll the plot and
view other measurements.
Control range
limits
Show the upper and the lower limits of the control range
for the highlighted measurement.
Dots Show the number of measurements for the selected
parameter. To view a measurement result, highlight a dot
on the screen and press Result.
Out-of-range
symbols
Measurement outside the control range and
inside the statistical range.
Measurement outside both the control and
statistical ranges.
Continued on next page
9-15