93
ifm Vision Assistant O3M
UK
11.4 Variant options of the DI firmware
The variant options contain options to display 3D objects in the 2D overlay.
The available options depend on the installed firmware (→ „7.1.3 Firmware update“). The following
options require the DI firmware basic functions.
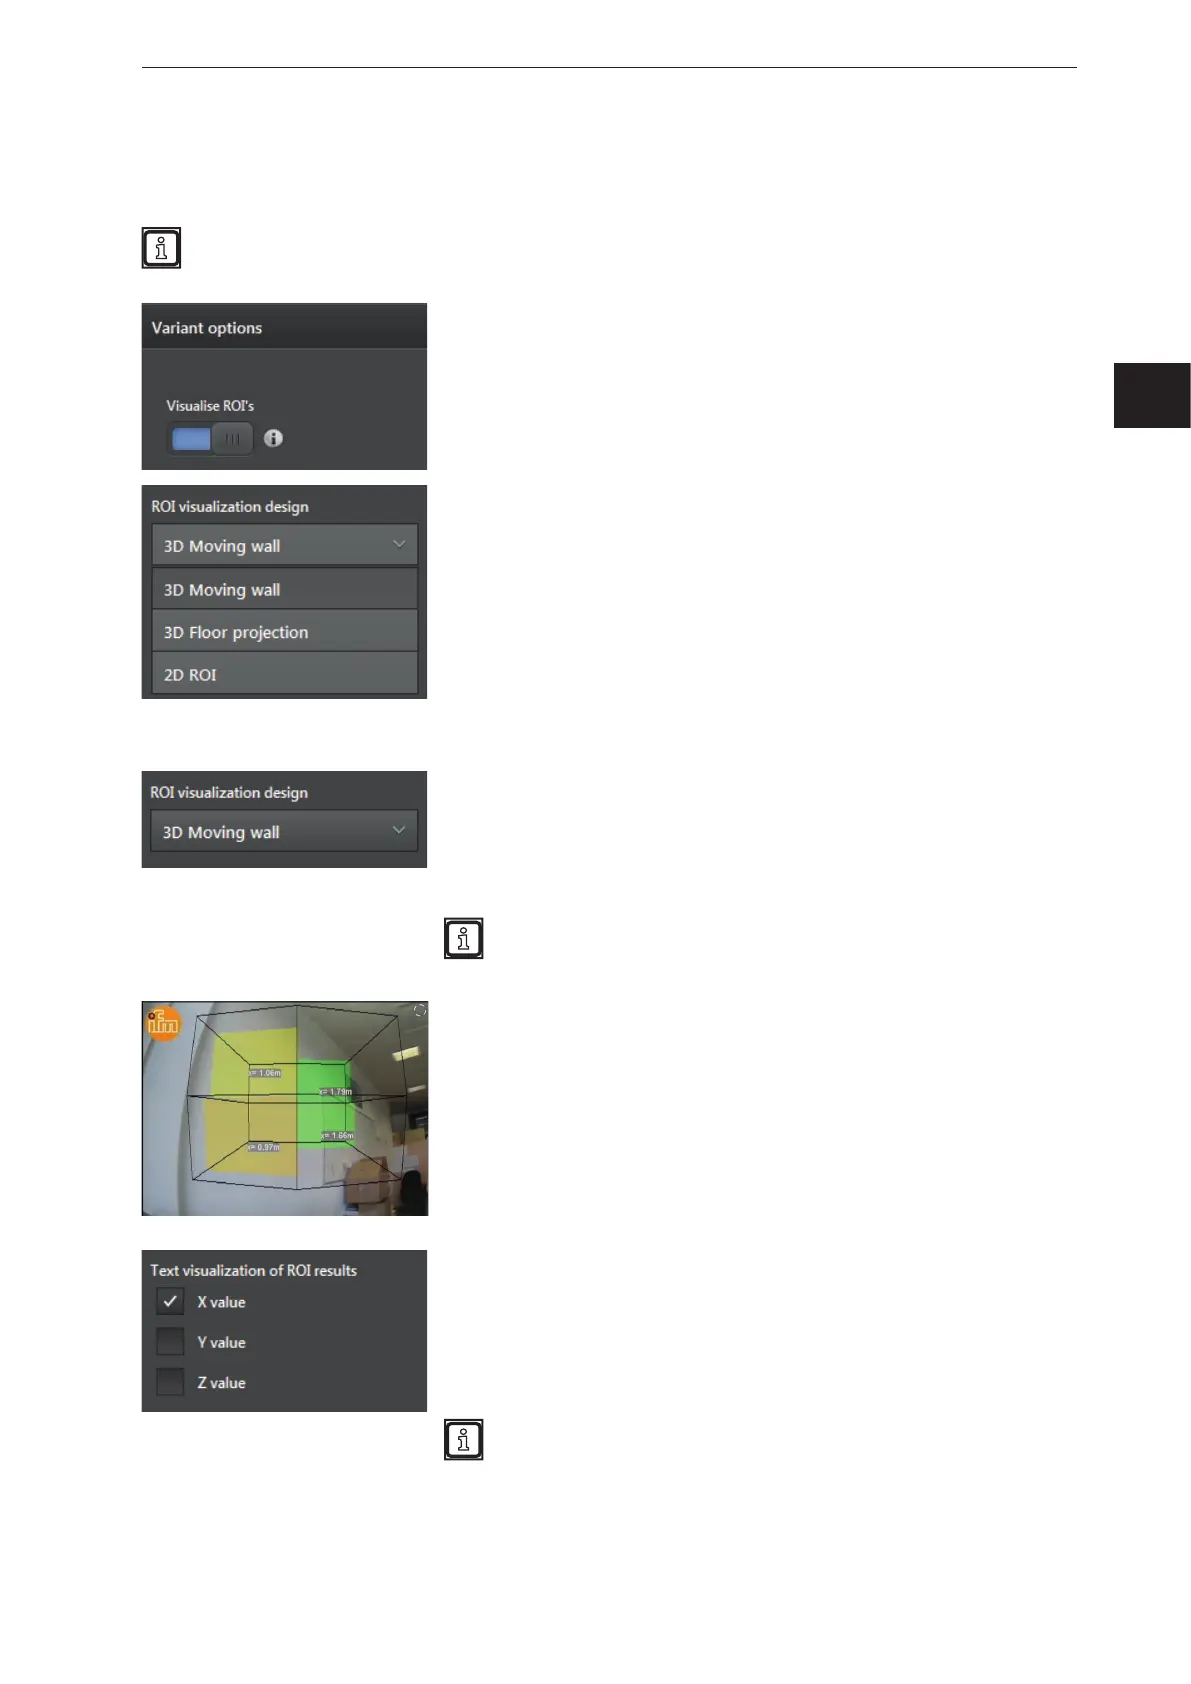
With the variant options of the DI firmware, Regions of Interest (ROI)
are shown and configured in the 2D overlay.
The switch "Visualise ROIs" activates the visualisation of ROIs in the
2D overlay.
In the list "ROI visualization design", the way the ROIs are visualised
can be set. The following types of visualisation are available:
● [3D moving wall]
(→ „11.4.1 Visualising 3D ROIs as a moving wall“)
● [3D projection floor projection]
(→ „Colour mode [Colour map]“)
● [2D ROI]
(→ „11.4.3 Visualisation of 2D ROIs“)
11.4.1 Visualising 3D ROIs as a moving wall
The ROI visualisation type "3D moving wall" shows the provision of the
ROI groups in the x, y and z axis (length, width and hight) as a coloured
overlay. The coloured overlay is visualised as a wall.
"Output" refers to the measuring result of the ROI group
(→ „12.2 Global settings“).
The ROI visualisation type "3D moving wall" is only suitable for
three-dimensionally defined ROIs (→ „12.1 ROI mode“).
In the figure on the left, the output of 4 ROI groups is visualised as a
coloured overlay and the X values as a text.
[Colour map] is set as "colour mode".
The "3D ROI frame" is set to [black].
The output of the ROI group can additionally be shown as text. In "text
visualisation ROI results", the control fields can be activated:
● X value
● Y value
● Z value
The text fields can overlap if several ROI groups are provided at
the same time.