ifm Vision Assistant O3M
98
11.4.2 Visualisation of 3D ROIs as a projection on the fl oor
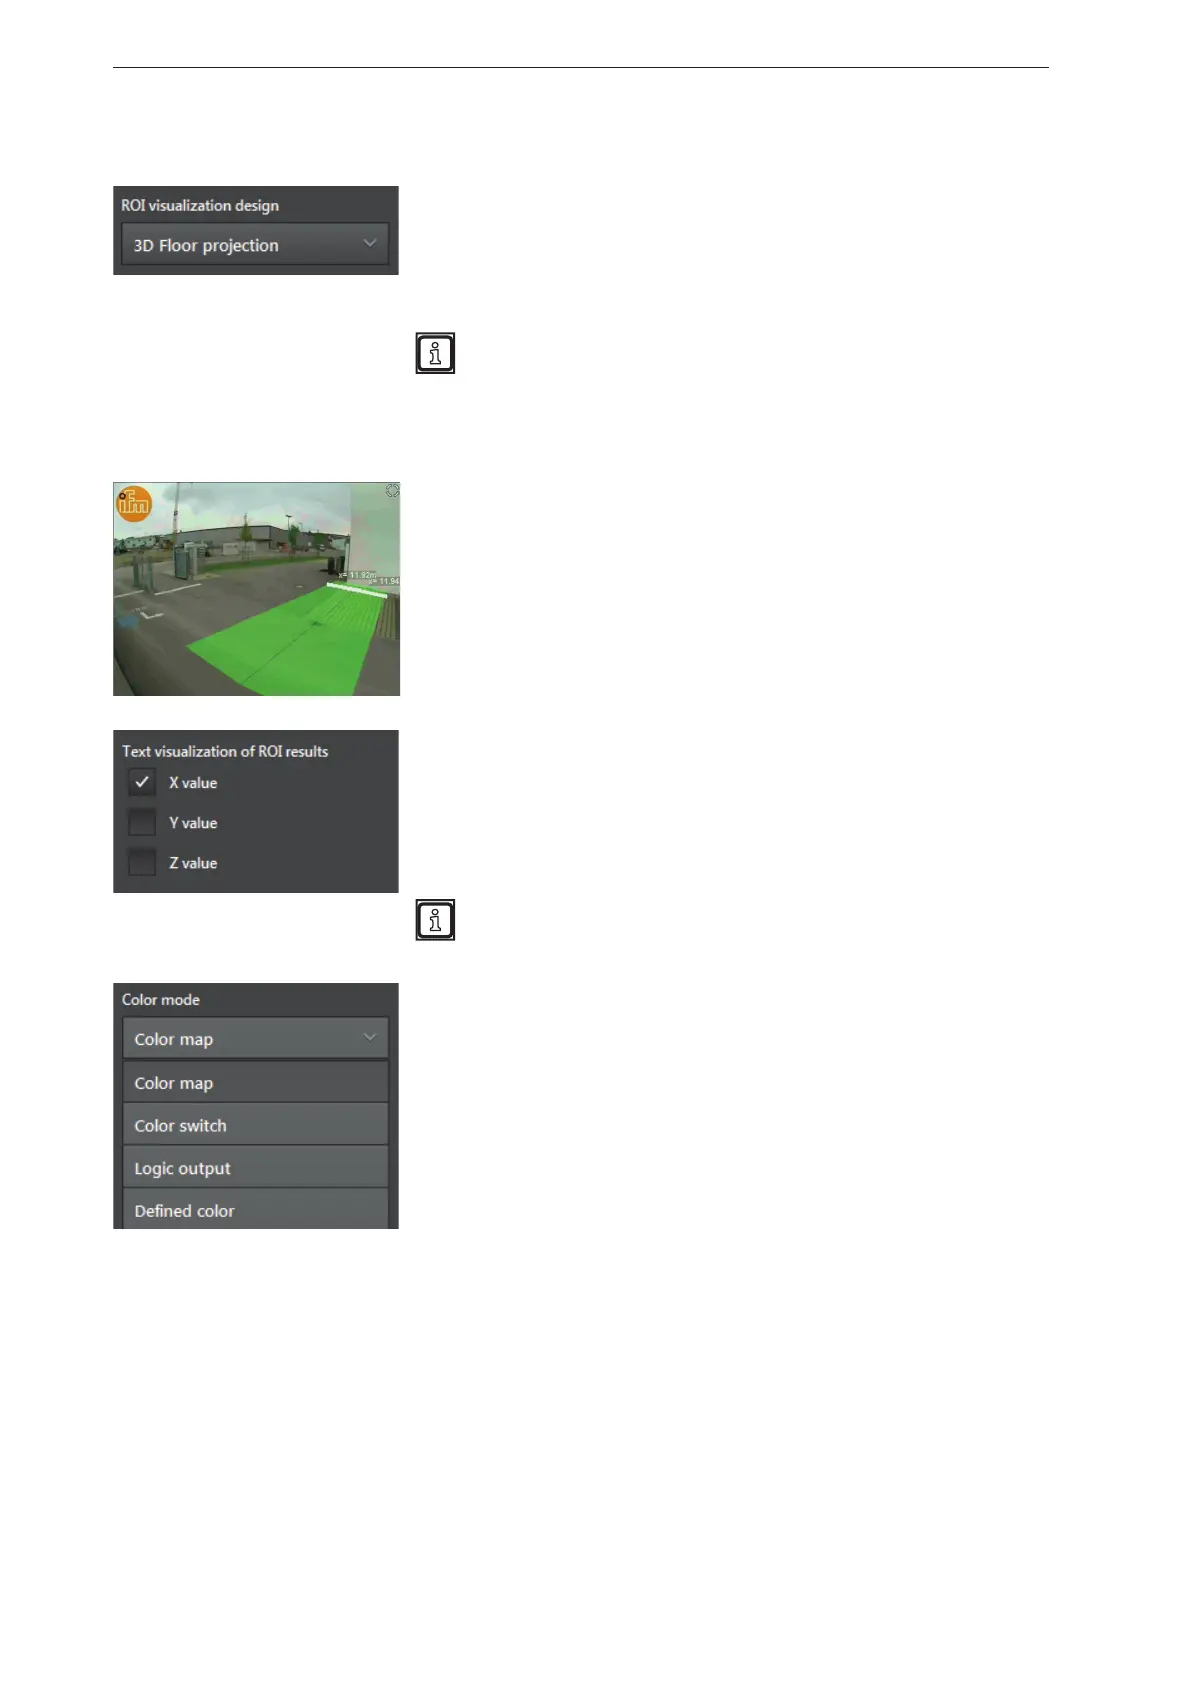
The ROI visualisation type "3D floor projection" shows the provision of
the ROI groups in the x, y and z axis (length and width) as a coloured
overlay. The coloured overlay is visualised as a projection on the floor.
"Output" refers to the measuring result of the ROI group
(→ „12.2 Global settings“).
The ROI visualisation type "3D floor projection" is only suitable for:
● three-dimensionally defined ROIs (→ „12.1 ROI mode“),
● ROIs lying next to each other (x and y axis)
(not suited for ROIs stacked on top of each other (z axis).
In the figure on the left, the provision of 2 ROI groups is visualised as a
coloured overlay on the floor and the X values as a text.
[Colour map] is set as "colour mode".
The "moving reference line" is set to [white].
The output of the ROI group can additionally be shown as text. In "text
visualisation ROI results", the control fields can be activated:
● X value
● Y value
● Z value
The text fields can overlap if several ROI groups are provided at
the same time.
In the list "colour mode", the behaviour of the colours of the colour
overlay can be set. The following colour modes are available:
● [Colour map]
The colour changes with the set reference value.
● [Colour switch]
After a threshold value is reached, there is a change between 2
colours.
● [Logic output]
The colour changes according to the condition of the virtual digital
outputs of the ROI groups.
● [Defined colour]
The colour setting is fixed and does not change.