45
5 Operation
5.1.2 Visualization window
The visualization of the measuring data and control data takes place in this area of the screen
(underneath the status and title line and above the function selection). The area for the config-
uration of the system will continue to be used.
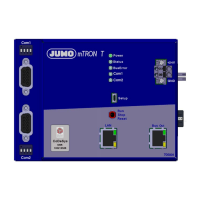
Example: Visualization of a controller (controller screen)
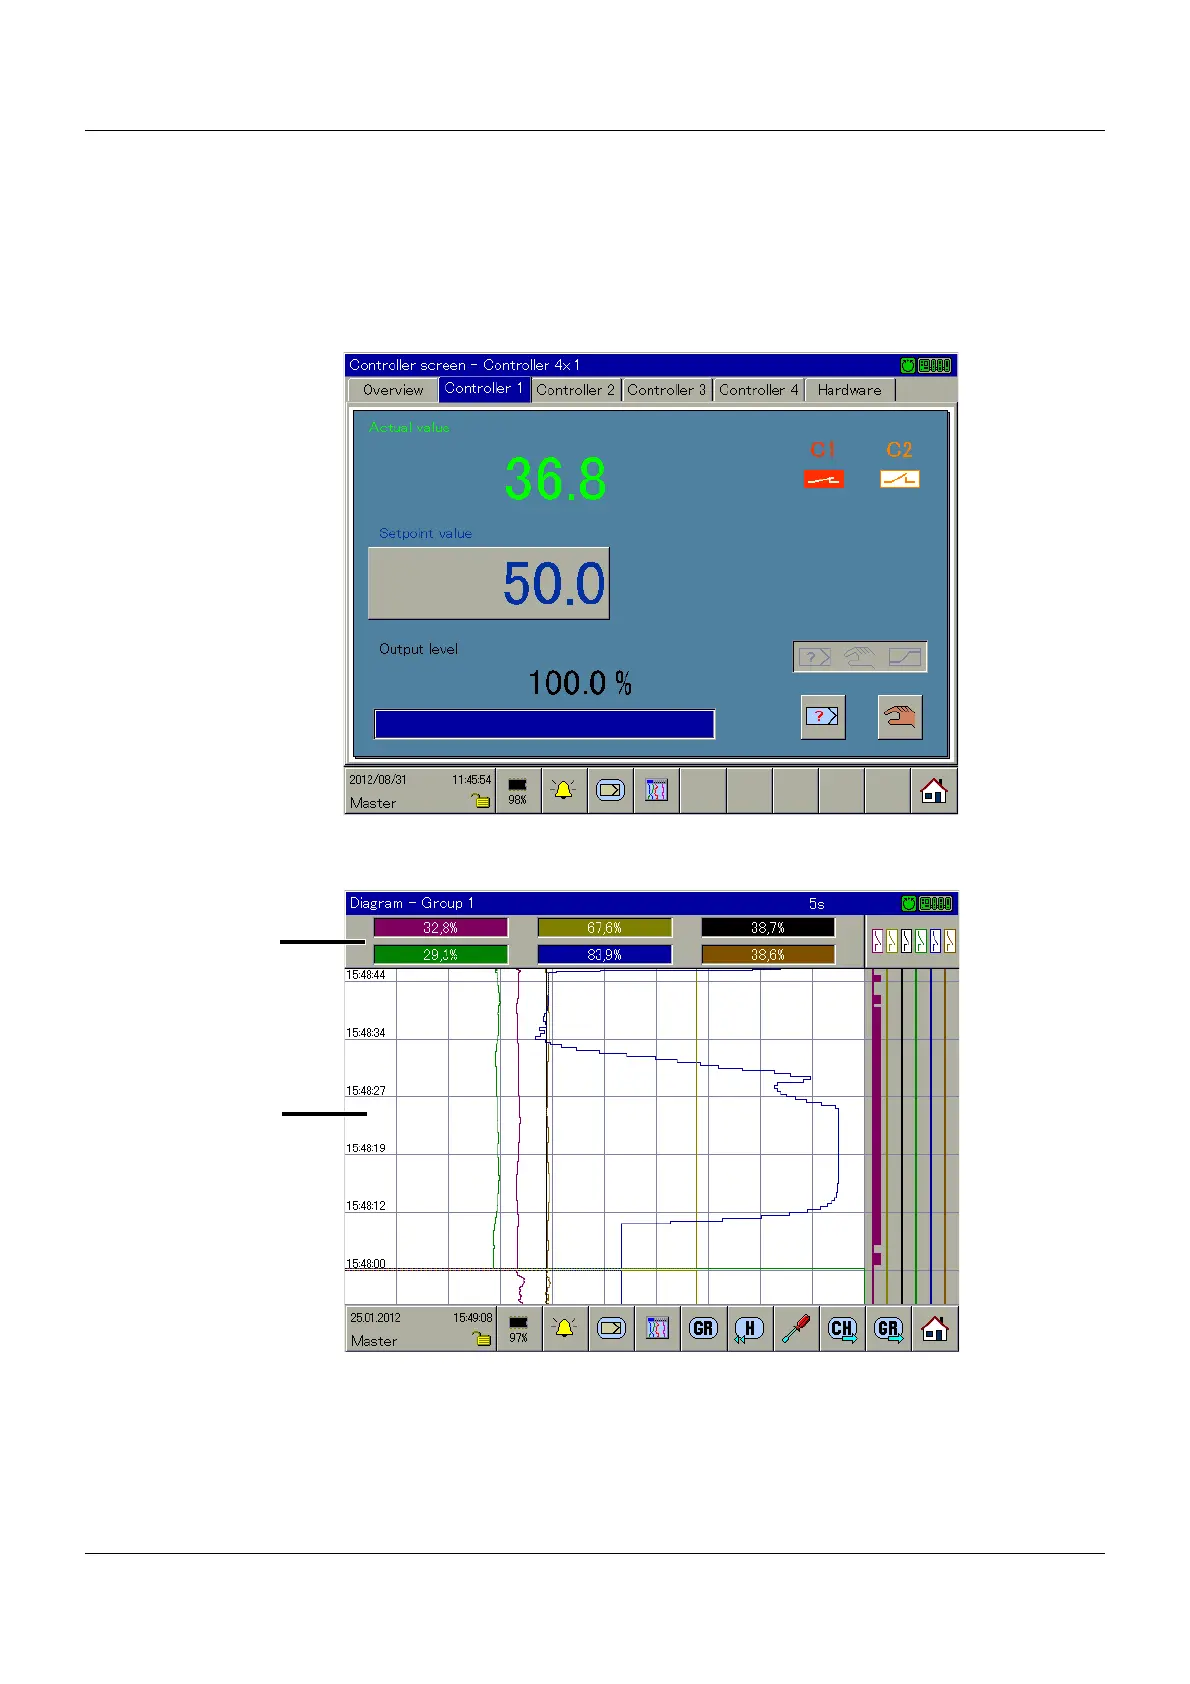
Example: Visualization of an analog channel
(1) Diagram header (2) Diagram