Front Panel Operation
3-117
ENTER key selects your value and takes you to the next
menu level:
LLIM #1 ACTION
DIGOUT1=OFF 2=OFF 3=OFF 4=OFF
With this menu, you select the action taken if low limit #1 is
the first limit to be exceeded. The desired states of the digital
outputs can be toggled between ON and OFF with the
RANGE ▲ and ▼ keys.
Pressing ENTER returns you to the LIMIT SET #1 menu.
Then set the value of the high limit #1 and its effect on the
digital outputs. Continue for limit set #2, if desired.
Each measurement function except frequency has a multiple
display for the limits bar graph. It shows a pass/fail indica-
tion and a graphical representation of the reading compared
to limit set #1. (Note: PASS/FAIL indication is not available
on ACV, ACI, and in-circuit current.) If low limit #1 is less
than high limit #1, you will see a display similar to that
shown in Figure 3-44.
Note that the Model 2001 does not check the validity of the
high and low limit values when you enter them. If low limit
#1 is greater than or equal to high limit #1, the following
message is shown on the bottom line of the limits bar graph
next display:
No bar graph: LLIM1 >= HLIM1
The programmed values for limit set #1 are shown by press-
ing the INFO key from the limits bar graph next display.
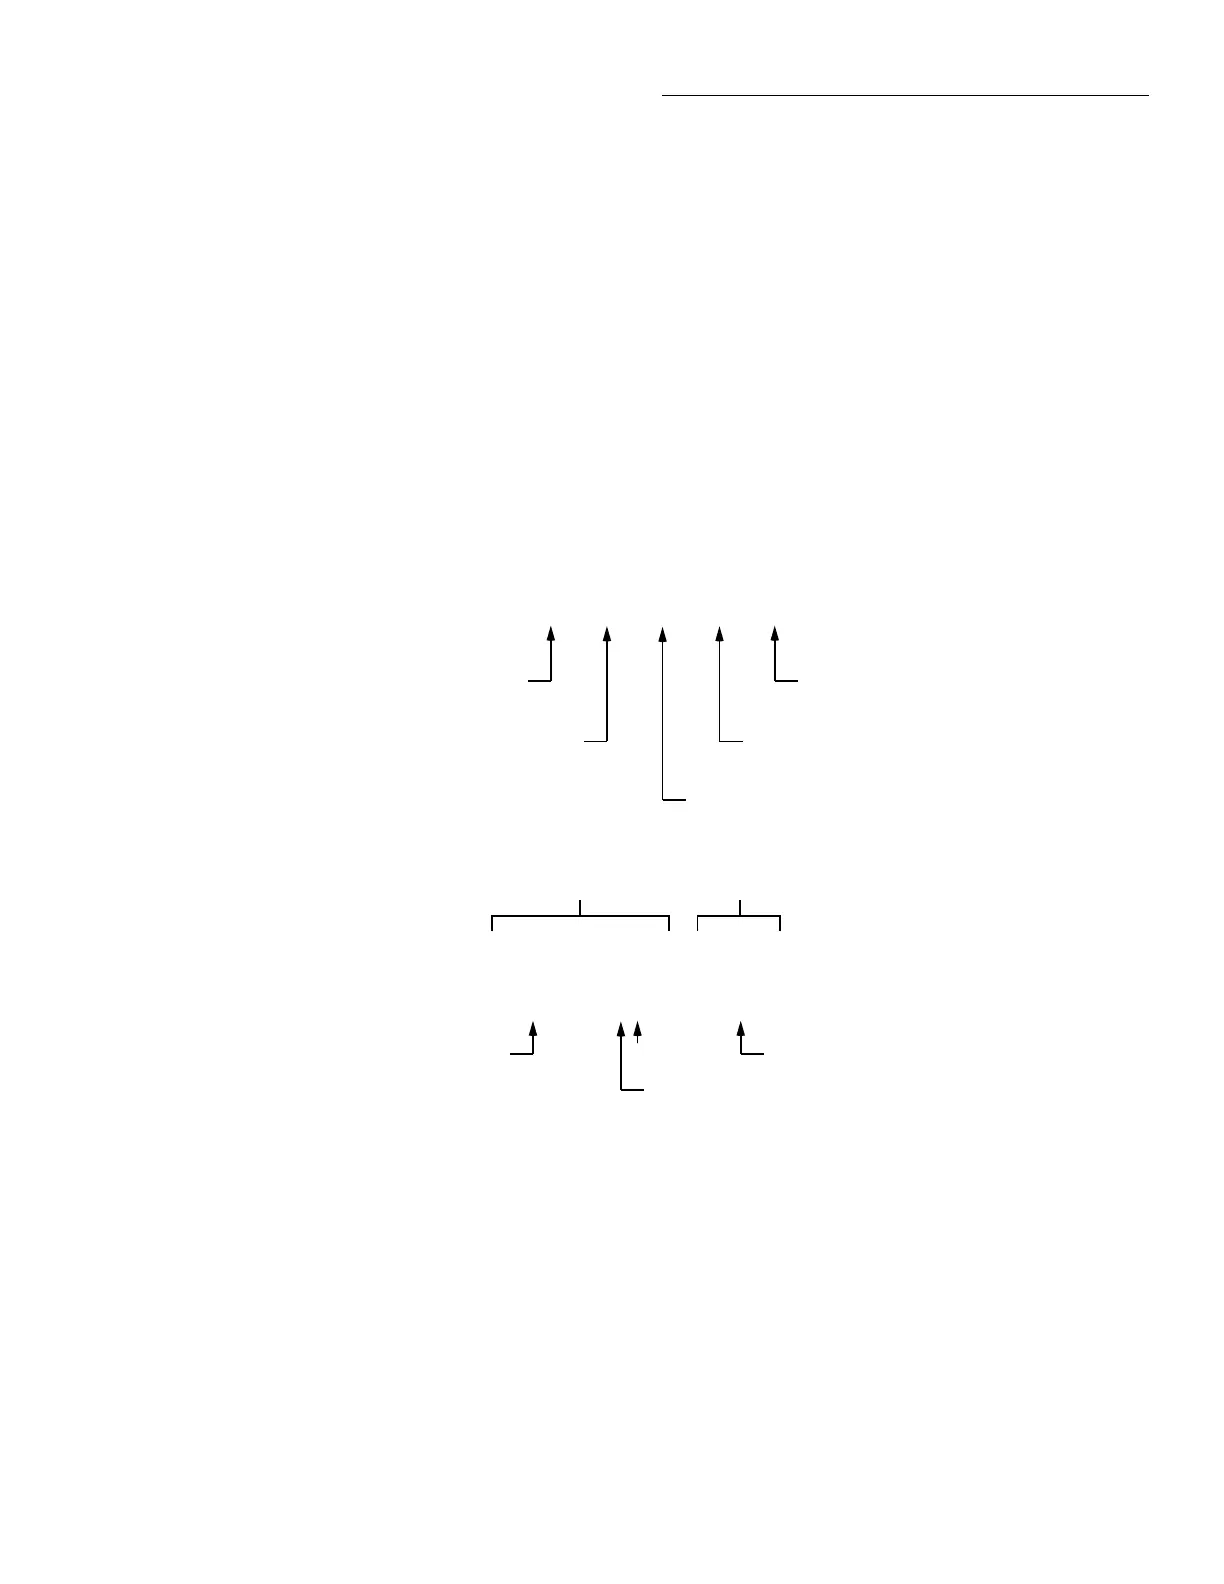
Figure 3-44
Limits bar graph example
LLIM1 | | | | | HLIM1
Low Limit #1
Average of midpoint and Low Limit #1
High Limit #1
Average of midpoint and High Limit #1
Midpoint of Low Limit #1 and High Limit #1
Reading Pass/Fail indication
-000.2836 VDC PASS
-1V
LLIM1 | | ===| | |
HLIM1
1V
0V
30% of difference between
midpoint and Low Level #1
NOTES : 1. Press INFO to view the programmed Low Limit #1 and High Limit #1 values.
2. Multiple display of limit values do not use unit prefixes (i.e., volts not millivolts).
B. Example Display with Limits = ±1V
A. Defined points of display