Front Panel Operation
3-8
Bar graph
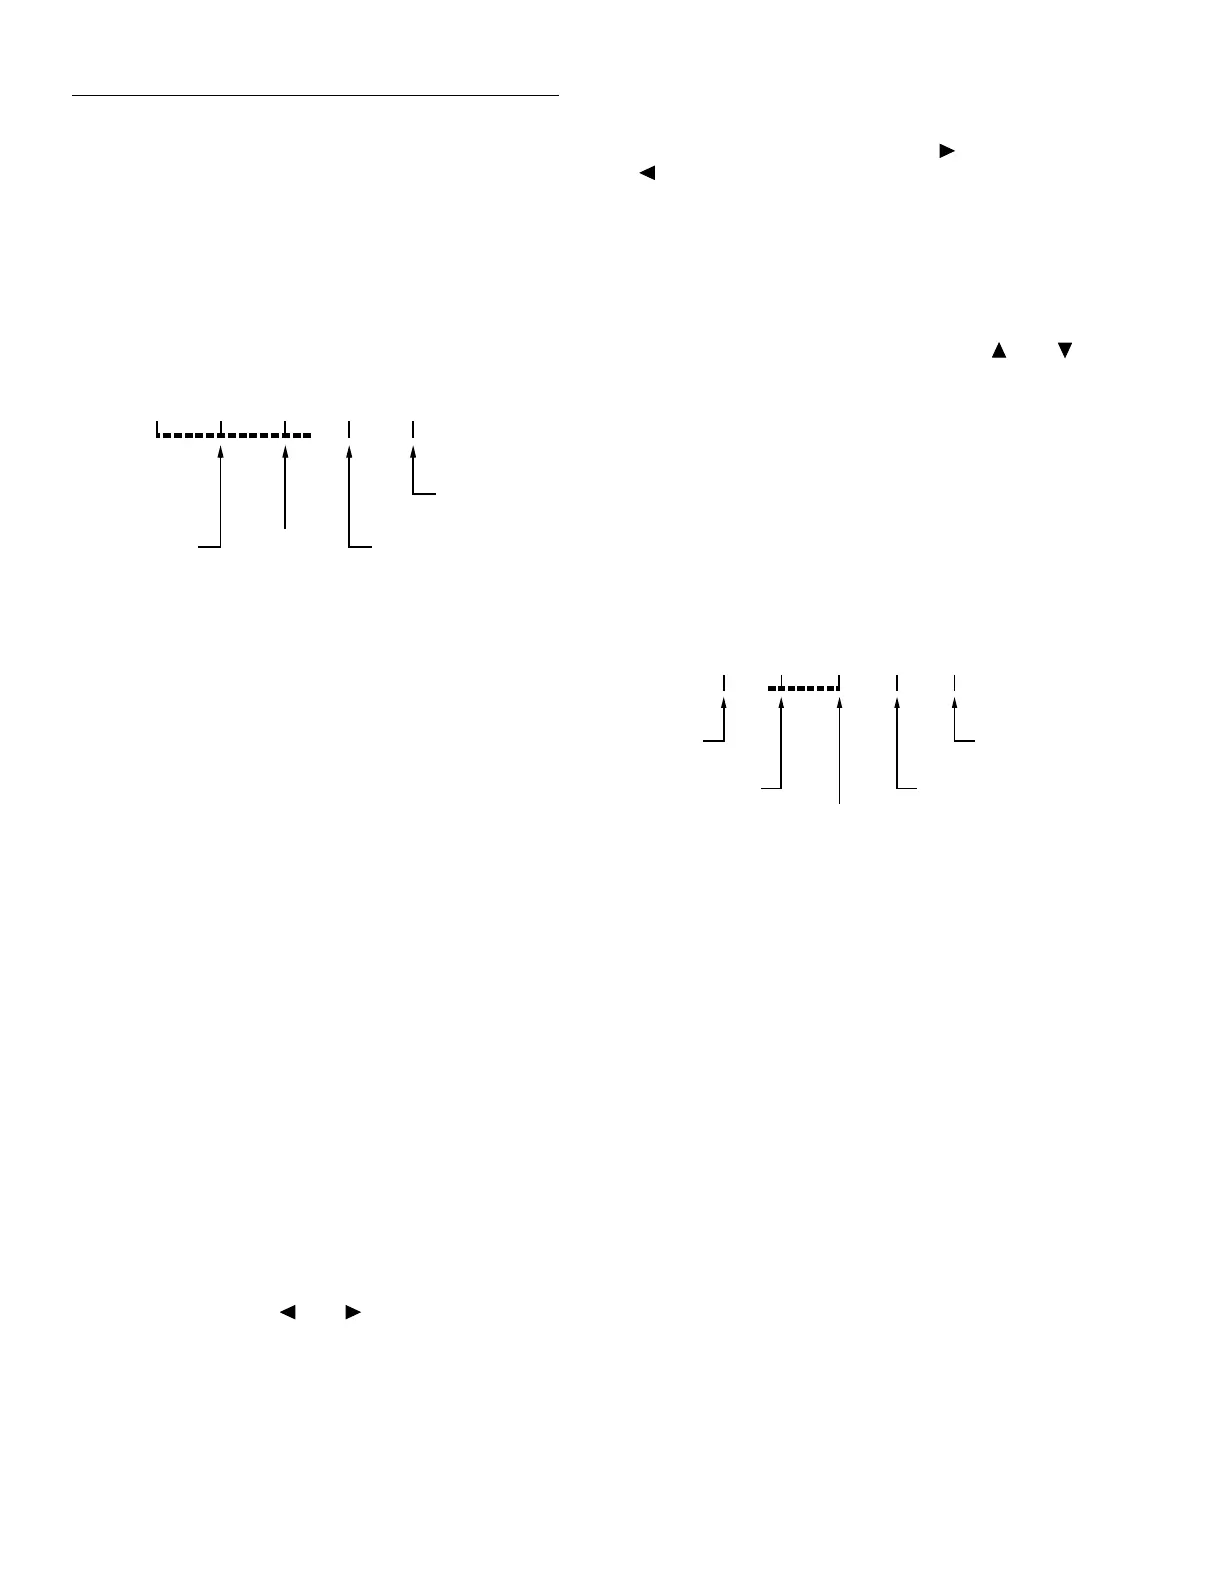
The “normal” bar graph, with a zero at the left end, is a
graphical representation of a reading as a portion of a range.
(See Figure 3-3.) The vertical lines displayed along the bar
designate 0%, 25%, 50%, 75%, and 100% of full scale. Each
full segment of the bar represents approximately 4% of the
range limit
.
For measurement functions with a range (voltage, current,
and resistance), the right endpoint of the bar graph is plus full
scale of the present range for positive readings, and minus
full scale for negative readings. When the 100% line changes
to an arrow, the reading exceeds the present range.
Note that the normal bar graph is not available when the
ACV units are dB or dBm.
For functions without a range (frequency and temperature),
the right endpoint of the bar graph is user-programmable by
pressing either CONFIG-NEXT DISPLAY or CONFIG-
PREV DISPLAY. Note that these configuration menus are
context-sensitive. If the unit is in any function except fre-
quency or temperature, CONFIG-NEXT DISPLAY results
in the zero bar graph configuration display.
Perform the following to view or change the range of the bar
graph:
1. From the frequency or temperature function, press the
CONFIG key and then the NEXT or PREV DISPLAY
key. The following menu is displayed:
BARGRAPH TYPE
ZERO-AT-LEFT ZERO-CENTERED
2. Use the cursor keys ( and ) to place the cursor on
ZERO-AT-LEFT and press ENTER. You will access one
of the following menus:
For frequency:
FREQ BARGRAPH RANGE
2Hz 20Hz 200Hz 2kHz 20kHz
200kHz 2MHz 15MHz
For temperature:
BARGRAPH:0 to 0040°C
3. Change the frequency range by highlighting one of the
selections and pressing ENTER. For the temperature
range, use the cursor keys and the RANGE and
keys to enter a numeric value (0 - 9999°C). Press EN-
TER when done.
Zero-centered bar graph
The zero-centered bar graph is a graphical representation of
a reading with plus and minus limits. (See Figure 3-4.) The
limits are expressed in a user-selectable percentage of range
for voltage, current, and resistance, and a user-selectable val-
ue for frequency and temperature.
The vertical lines displayed along the bar designate the plus
and minus limits, zero, and halfway to either limit. There are
ten full segments between zero and each end, so each full
segment represents 10% of the limit. When a line at the limit
changes to an arrow, the reading exceeds the programmed
range.
The plus and minus percentage of range that is programmed
(0.01 - 99.99%) applies to all voltage, current, and resistance
functions. Because of rounding, values greater than 99.5%
are shown as 100% and, likewise, values greater than 1%
(such as 1.67%) are shown rounded to the nearest integer
percent.
Note that the zero-centered bar graph is not available when
the ACV units are dB or dBm.
Perform the following to view or change the plus and minus
percentage of range:
igure 3-3
ar graph (zero-at-left) multiple display
25% of
full range
Full
Range
-11.96859 VDC
50% of
full range
75% of full range
0 -20V
igure 3-4
Zero-centered bar graph multiple display
-25% of range
+50% of range
-05.95770 VDC
0%
25% of range
-50% +50%
-50% of range